
Please review my IELTS essay task 1. Thank you!
My essay:
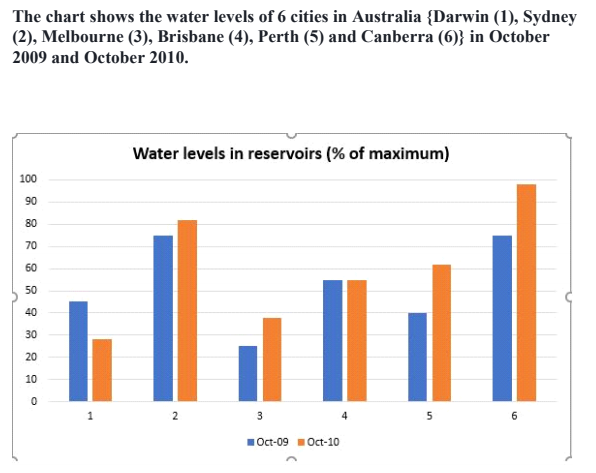
The bar chart compares the percentage of water reserved in different cities in Australia in October 2009 and one year later – October 2010.
Overall, the level of water in most cities was higher in October 2010 compared to the same month of the previous year. Canberra had the highest proportion of water level in 2010.
The water level of Canberra was 75% in October 2009, I went up to approximately 100% one year later, making Canberra the city with the highest level of water. Sydney came second at 81% in 2010, although the level of water in reservoirs was the same as Canberra’s in 2009.
While the figures for Brisbane were stable at 55% in the two years, the level of water in Melbourne and Perth increased after one year, beginning from 25% and 40% in 2009, respectively and finishing at 39% and 61% in 2010, respectively.
In contrast, Darwin saw a decrease in the percentage of water reserved. The figure for Darwin was 45% in 2009 and then decreased by 16% to reach 29% in 2010.
Top answer
You did not understand what this chart was portraying, or you did not describe it correctly. The bar chart compares the percentage of water reserved (incorrect description of the measurement) in different cities in Australia in October 2009 and one year later – October 2010. (Your paragraph is incomplete.
- You did not understand what this chart was portraying, or you did not describe it correctly.
- The bar chart compares the percentage of water reserved (incorrect description of the measurement) in different cities in Australia in October 2009 and one year later – October 2010.
- (Your paragraph is incomplete.
- How many cities?
- ) Overall, the level of water in most cities was higher in October 2010 compared to the same month of the previous year.
Get the Weekly English Kit 📬
New words, one handy idiom, and a 2-minute quiz — delivered to your inbox to keep your streak alive.
You did not understand what this chart was portraying, or you did not describe it correctly.
The bar chart compares the percentage of water reserved (incorrect description of the measurement) in different cities in Australia in October 2009 and one year later – October 2010. (Your paragraph is incomplete. How many cities? What
 Related Questions