
Please review my IELTS essay- Task 1- Education.
Topic:
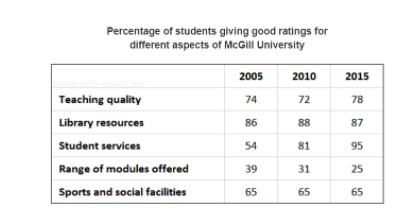
The table below shows the results of surveys in 2005, 2010 and 2015 about McGill University.
Summarise the information by selecting and reporting the main features, and make comparisons where relevant.
My essay:
The table presents the ratio of learners having good responses to various factors of McGill University.
It can be observed from the table that different factors have different trends of the ratio of good responses. Meanwhile, the ratio of good responses has remained unchanged or has been nearly constant in the cases of “teaching quality”, “library resources”, and “sports and social facilities”, it has increased or decreased significantly in the cases of “students services”, and “range of modules offered”.
Although having different trends, the strongest and weakest factors have been stable. Particularly, “library resources” ranked first in 2005, and 2010, and ranked second in 2015, whereas “range of modules offered” was the worst in 2005, 2010, and 2015.
Top answer
Please read my advice for Task 1 essays: IELTS TASK 1: Hints, Tips And Advice Vocabulary Words For Task 1: Reference Post
- Please read my advice for Task 1 essays: IELTS TASK 1: Hints, Tips And Advice Vocabulary Words For Task 1: Reference Post
Get the Weekly English Kit 📬
New words, one handy idiom, and a 2-minute quiz — delivered to your inbox to keep your streak alive.
thaoincosThe table presents the ratio of learners having good responses to various factors of McGill University.
Presents - not a good verb here. Read my advice.
Rat
Your essay is less than 120 words The minimum is 150. You will lose points for not writing enough.
Use "trend" for line graphs. Tables and bar charts only show limited time points. You cannot see any trend for just a few points.
You did not clearly indicate the "main features."
It can be observed from the table that Delete - these are extraneous words.
 Related Questions