
Please review my IELTS essay task 1
My essay:
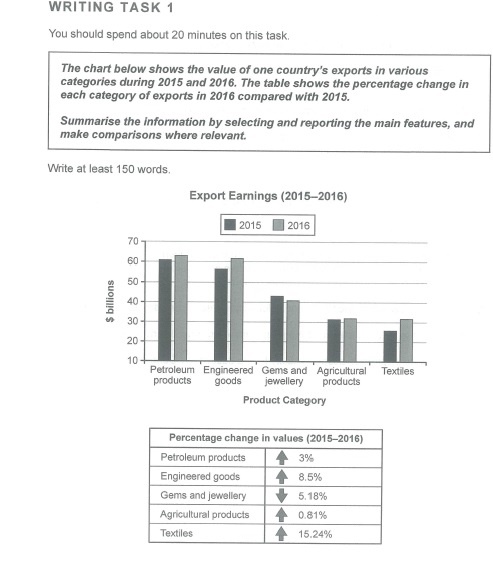
The bar chart depicts the export earning of a country in 5 different categories between the years 2015 and 2016. The table data portrays percentage change in export net worth in 2016 than 2015.
Overall, petroleum and engineered products were the main earners for the country in both the years. The export income increased in 2016 than previous year except for gems and jewellery goods.
In 2015, earning from petroleum export was over 60 billion dollars which was the highest while, the engineered good brought was nearly 58 billion, the second highest. Next year they made around 63 and 62 billion respectively. Gems and jewellery and agricultural export earning was about 70 billion while, textiles produced nearly 25 billion which was the lowest. In 2016, textile and agricultural exported earning was 30 billion dollar each and nearly 40 billion dollar’s jewellery.
The percentage value in 2016 increased for all products except for jewellery that dropped by 5.18%. The export of engineered goods soared by 8% while, the highest increase was textiles 15.24%. Other products petroleum and agricultural increased by 3% and 0.81% respectively.
A humble request to provide band score along with the review. Thank you.
Top answer
The bar chart depicts the export earning (wrong form) of a country in 5 five different categories between the years (wrong expression ) in 2015 and 2016. ) in 2016 than (wrong word) 2015. Overall, petroleum and engineered products were the main earners for the country in both the ( "Both" is a determiner.
- The bar chart depicts the export earning (wrong form) of a country in 5 five different categories between the years (wrong expression ) in 2015 and 2016.
- ) in 2016 than (wrong word) 2015.
- Overall, petroleum and engineered products were the main earners for the country in both the ( "Both" is a determiner.
- "The" is a determiner.
- ) years.
Get the Weekly English Kit 📬
New words, one handy idiom, and a 2-minute quiz — delivered to your inbox to keep your streak alive.
The bar chart depicts the export earning (wrong form) of a country in 5 five different categories between the years (wrong expression ) in 2015 and 2016. The table data
Sample essay:
- In the opening paragraph, I remark that the data in the table is derived from the values in the bar chart.
- In the overall paragraph, I observe the ordering of the categories, and that only one had declined
- In the detail paragraph, I combine the two largest categories because they represented more than half of the total export va
 Related Questions