
Please review my IELTS essay task 1
Topic: The charts below show the results of a survey conducted by a university library to find out the opinions of full-time and part-time students about its services.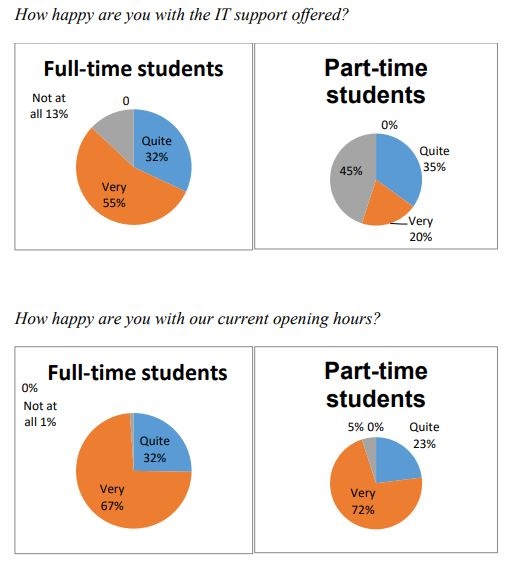
My essay:
The pie charts display the responses of students to a survey carried out by university library about their IT support and current opening hours.
Overall, there was a larger proportion of full-time students felt happy with the IT support than that of part-time students, while the majority of students were very satisfied with the library's opening hours.
In details, there was nearly an equal percentage of full-time and part-time students who said that they were quite pleased, at 32% and 35%. At the very happy level, 55% of full-time students voted for that whereas only 22% of part-time ones felt that way. The proportion of 43% part-time students were not at all happy with IT support which was also voted by 13% of part-time students.
In term of opening hours, the percentage of part-time and full-time students felt satisfied were the largest, at 72% and 67% respectively. There was 32% of full-time students were quite happy compared to 23% of those in the other group. Finally, very small amount of students were not at all pleased, with 1% full -time and 5% part-time students.
Thanks a lot!
Top answer
Please post essays in the Essay, Paragraph, Dialog & other Composition Writing section. AlpheccaStars has already explained this to you here .
- Please post essays in the Essay, Paragraph, Dialog & other Composition Writing section.
- AlpheccaStars has already explained this to you here .
Get the Weekly English Kit 📬
New words, one handy idiom, and a 2-minute quiz — delivered to your inbox to keep your streak alive.
Please post essays in the Essay, Paragraph, Dialog & other Composition Writing section.
AlpheccaStars has already explained this to you here.
 Related Questions