
Please review my IELTS essay (RTI - TEST 7 - TASK 1)
The bar chart below shows the average monthly maximum temperatures for three Australian cities in the year 2016.
Summarise the information by selecting and reporting the main features, and make comparisons where relevant.
Write at least 150 words.
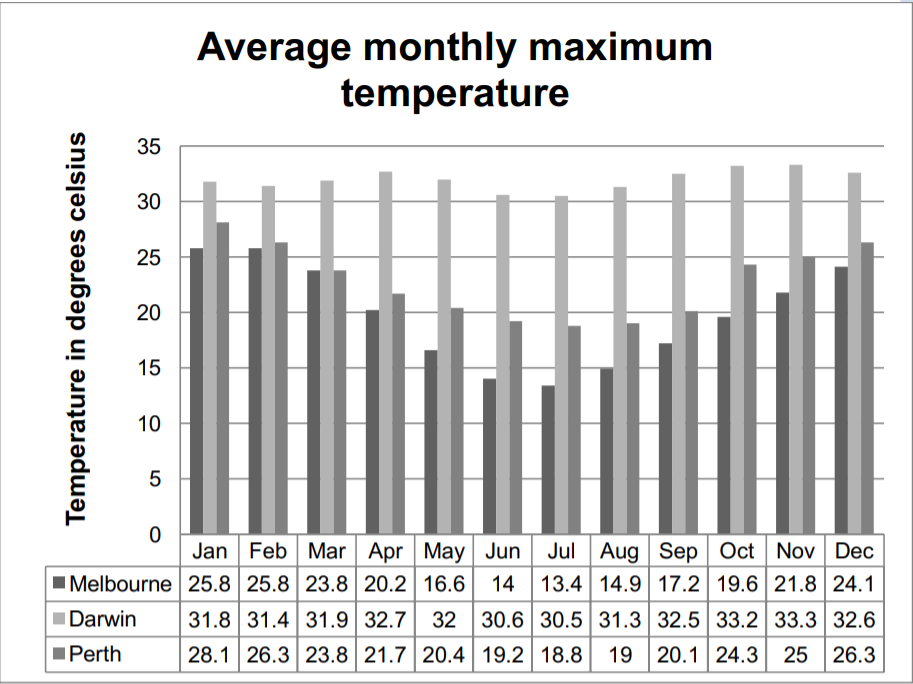
The bar chart compares the average maximum temperatures each month in 2016 for Melbourne, Darwin and Perth, which are located in Australia.
Overall, Darwin had highest average temperature pattern in three cities and there were only minor variations over one-year period while Melbourne and Perth were quite similar, in several aspects.
In detail, there were no months recorded to be under 30 degrees Celsius and no significant changes throughout the year 2016 in Darwin. Its monthly maximum temperature at average stayed within the range 30.5 to 33.3 degrees. Both Perth and Melbourne had a little bit lower temperature patterns than Darwin. In addition, there was a drop in the average temperature in the middle of the year, which was followed by a recovery until the end of the year in these two cities. Perth was warmer than Melbourne, with the maximum of 28.1 degrees in the first month and the minimum of 19 degrees in August. Meanwhile, the coolest month in Melbourne was June (14 degrees), two times as low as the warmest month in Perth, and the first two month in Melbourne recorded the highest temperature, 25.8 degrees.
(187 words)
Top answer
The bar chart compares the average maximum temperatures each month in 2016 for Melbourne, Darwin and Perth, cities which are located in Australia. ) and there were only minor variations over the year. one-year period while Melbourne and Perth (be specific) had very similar patterns, with highest temperatures in December and January, and lows six months later.
- The bar chart compares the average maximum temperatures each month in 2016 for Melbourne, Darwin and Perth, cities which are located in Australia.
- ) and there were only minor variations over the year.
- one-year period while Melbourne and Perth (be specific) had very similar patterns, with highest temperatures in December and January, and lows six months later.
- were quite similar, in several aspects .
- In detail, there were no months recorded to be with a measure under 30 degrees Celsius and no significant variations changes throughout the year 2016 in Darwin ; the value Its monthly maximum temperature at average (You do not need to repeat this.
Get the Weekly English Kit 📬
New words, one handy idiom, and a 2-minute quiz — delivered to your inbox to keep your streak alive.
The bar chart compares the average maximum temperatures each month in 2016 for Melbourne, Darwin and Perth, cities which are located in Australia.
Overall, Darwin had highest average temperatures pattern in three cities (This is unnecessary since you have named all the cities on the c
 Related Questions