
Please review my IELTS essay
Question:
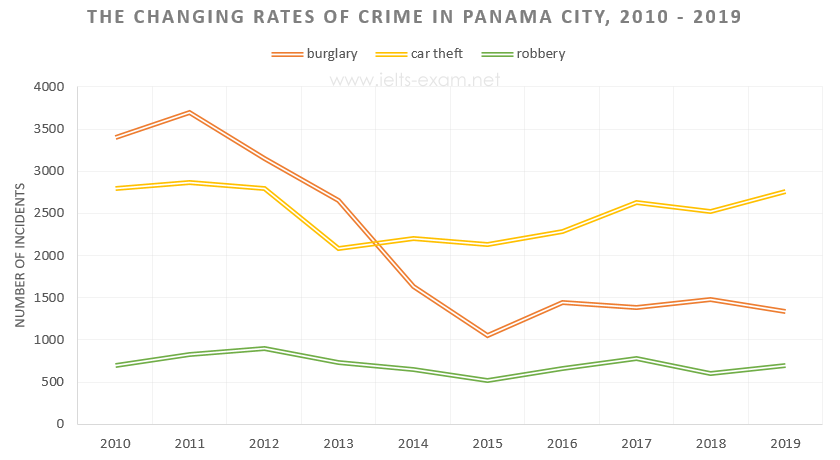
The chart below shows the changes that took place in three different areas of crime in Panama City from 2010 to 2019.
Summarise the information by selecting and reporting the main features, and make comparisons where relevant.
My answer:
The line graph plots the changing rates of crime that took place in three areas in Panama city between 2010 and 2019. Types of crime are burglary, car theft and robbery. Values are given in the number of accidents.
Overall, the number of incidents in the burglary crime rate showed a marked decline over the period. The others are car theft and robbery, which went back to the same level at the end as the beginning.
In detail, burglary was the highest number, about 3500 incidents, after that with car theft being 2800 incidents, and the lowest crime came from robbery, 520 accidents in 2010. There was a peak at 3600 incidents in 2011 in burglary, followed by a significant decrease from that time to 2015, subsequently remaining at less than 1500 in the last year. Those who committed crimes in car theft fell to approximately 2000 incidents in 2013, then went up to nearly the aforementioned figure in the first year. During the nine years, the robbery rates in crime fluctuated between 500 and 1000 incidents.
Top answer
Please read my advice for Task 1 essays. You did not read these posts, did you? IELTS TASK 1: Hints, Tips And Advice Vocabulary Words For Task 1: Reference Post
- Please read my advice for Task 1 essays.
- You did not read these posts, did you?
- IELTS TASK 1: Hints, Tips And Advice Vocabulary Words For Task 1: Reference Post
Get the Weekly English Kit 📬
New words, one handy idiom, and a 2-minute quiz — delivered to your inbox to keep your streak alive.
Please read my advice for Task 1 essays. You did not read these posts, did you?
The line graph plots the changing crime rates (Read my advice. The plots actually does not show rates of crime. The title is incorrect. Crime rates are the number of crimes per 1000 people per year, for example. Only by measuring rates can you compare the safety of different
 Related Questions