
Please review my IELTS essay
Hi guys. Here is my essay in IELTS Writing Task 1. Anyone's comments or corrections for my low-key piece of writing are genuinely welcome. I really appreciate any help you can provide.
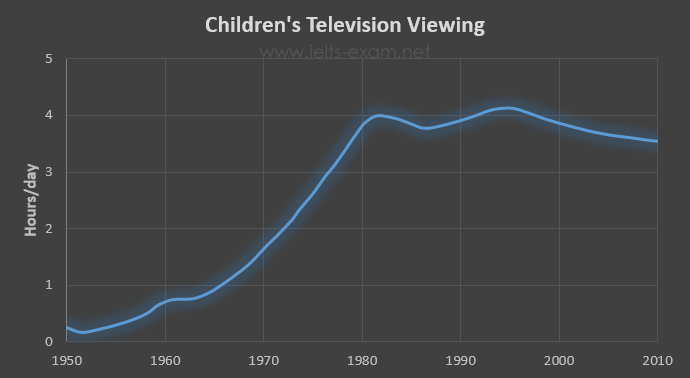
Topic: The graph below shows the number of hours per day on average that children spent watching television between 1950 and 2010.
Summarise the information by selecting and reporting the main features, and make comparisons where relevant.
My essay:
The line graph compares the quantities of average hours each day that young people took time to watch TV from 1950 to 2010.
Overall, there was an upward trend in the number of hours each day on average for juveniles who spent time watching television during the mentioned whole period. Moreover, the figure for television's viewing time reached to peak in the course of 60 years.
In 1950, the amount of average time concerning TV viewing by youngsters stood at more than 0 hours per day. From the first year to 1980, that increased significantly to nearly 4 hours daily.
Between 1980 to 2010, having a fluctuation of around 4 hours per day for the figure regarding time was allocated to television. Meanwhile, a peak of over 4 hours per day on average was seen for kids, then followed by a marginal decline to approximately 3.5 hours each day in the last year.
Top answer
Please read my advice for Task 1 essays: IELTS TASK 1: Hints, Tips And Advice Vocabulary Words For Task 1: Reference Post Your essay is exactly the minimum word count, 150. That is really not enough. Try to write 170-200 words for Task 1.
- Please read my advice for Task 1 essays: IELTS TASK 1: Hints, Tips And Advice Vocabulary Words For Task 1: Reference Post Your essay is exactly the minimum word count, 150.
- That is really not enough.
- Try to write 170-200 words for Task 1.
- com/word-counter/
Get the Weekly English Kit 📬
New words, one handy idiom, and a 2-minute quiz — delivered to your inbox to keep your streak alive.
The line graph compares (There is one curve. For "compare" you need more than one category or item being measured,) the quantities (wrong word. Incorrect.) of average hours (wrong expression. An "average hour" makes no sense. E
 Related Questions