
Please review my IELTS essay
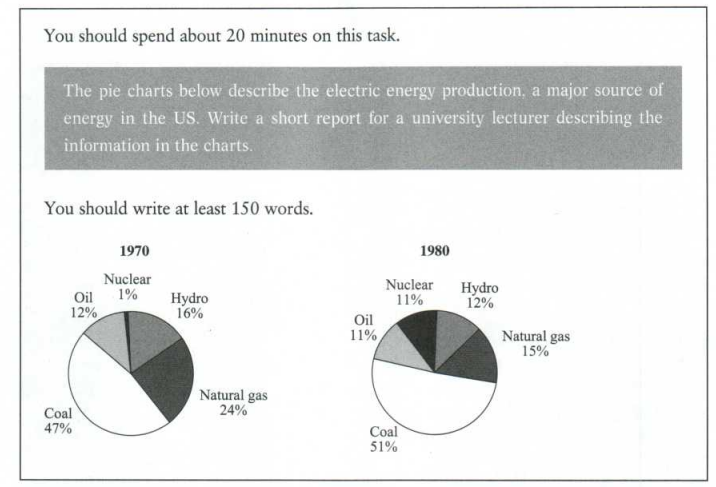
Two pie charts describe the change in five energy sources to produce electric energy in the US between 1970 and 1980.
Overall, coal sources accounted for nearly half of the total of both charts while a significant variation appeared in nuclear after a decade.
Both coal and nuclear sources increased by fourteen percent from 1970 to 1980. In particular, coal source was 47% in 1970 and had slightly increased to 51% in 1980, closely half of both charts. In contrast, nuclear accounted for a small amount which was only 1% in 1970 but after ten years, dramatically went up by 10 percent.
On the other hand, three sources including natural gas, hydrogen, and oil had a little alteration, generally, decreasing from 52% to 48% in ten years. Hydro and oil were 28%, all told, in 1970 and those dropped unsignificantly to 12% and 11%, respectively. Whereas, natural gas declined significantly by nearly half compared to the former after ten years.
Top answer
Two pie charts describe the change in five energy sources to produce electric energy in the US between 1970 and 1980. There are thee issues with your first paragraph. 1.
- Two pie charts describe the change in five energy sources to produce electric energy in the US between 1970 and 1980.
- There are thee issues with your first paragraph.
- 1.
- "Describe" - A description is a paragraph in words.
- The pie charts do not have any paragraphs.
Get the Weekly English Kit 📬
New words, one handy idiom, and a 2-minute quiz — delivered to your inbox to keep your streak alive.
Two pie charts describe the change in five energy sources to produce electric energy in the US between 1970 and 1980.
There are thee issues with your first paragraph.
1. "Describe" - A description is a paragraph in wo
Nina228electric energy
This is odd and wordy. Native speakers usually just say electricity.
 Related Questions