
Please review my IELTS essay
Writing Task 1
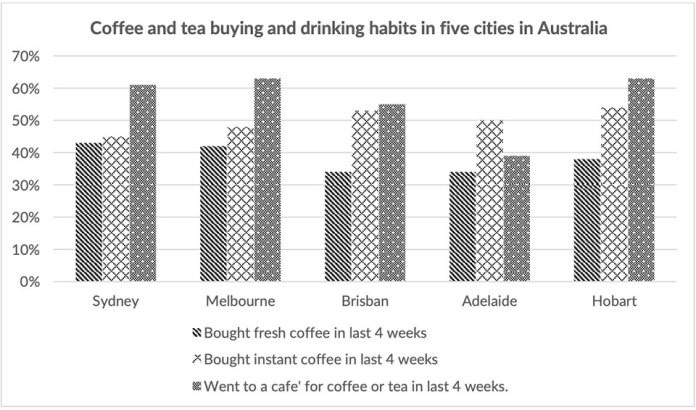
The chart below shows the results of a survey about people’s coffee and tea buying and drinking habits in five Australian cities.
Summaries the information by selecting and reporting the main features, and make comparisons where relevant.
Write at least 150 words.
My essay:
The following bar chart gives information about the survey’s results on paying for coffee and tea and the consuming habits of citizens in five cities in Australia in the last 4 weeks. In general, people went to cafés more frequently than buy coffee, except for Adelaide. The percentage of citizens buying instant coffee was always higher than purchasing fresh coffee.
In terms of Sydney, Melbourne, the percentage of people in two cities going to Café is over 60%, and the highest figure, which is in Melbourne, is about 63%. Both people in Sydney and Melbourne prefer consuming instant coffee than fresh coffee. While the percentage of instant coffee buying in Melbourne is 48% which is 4% higher than the rate in Sydney, the figure of people in Melbourne liking fresh coffee is lower than in Sydney.
Moving to the three cities remaining, having coffee or tea at a café accounts for 64% in Hobart followed by Brisban and Adelaide. The proportion of paying for instant coffee is almost the same in Brisban and Hobart about 52% and is 50% in Adelaide. Finally, it is nearly the same with fresh coffee consumption in Brisban and Adelaide while Hobart’s figure is higher, around 38%.
Get the Weekly English Kit 📬
New words, one handy idiom, and a 2-minute quiz — delivered to your inbox to keep your streak alive.
 Related Questions