
Please review my IELTS essay
You should spend about 20 minutes on this task.
The chart below shows the amount of money per week spent on fast foods in Britain. The graph shows the trends in consumption of fast foods.
Write a report for a university lecturer describing the information shown below.
You should write at least 150 words.
My essay:
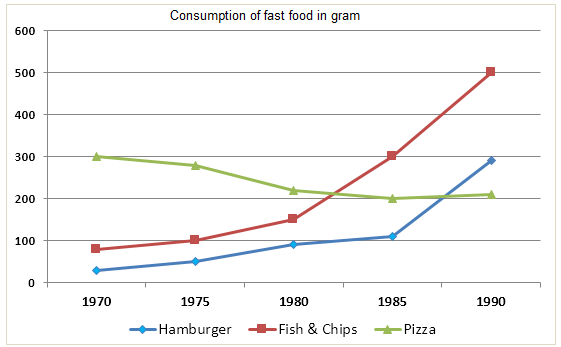
The line graph plots the amount of three types of fast foods (hamburger, pizza and fish & chips) British people ate in a week between 1970 and 1990.
Overall, people consumed more and more of these fast foods throughout the period as the continuous rise in hamburger and fish & chips more than offset the drop in pizza. Pizza was the most popular fast food in 1970, but it dropped to end at the least in 1990.
In detail, the total consumption increased by 57%, from 430 to 1000 grams per week, over the 30-year period. Most of that rise was from fish & chips, which started in second place at 90 grams in 1970 and increased exponentially, going up by a factor of five to 500 grams in 1970. It also tracked the curve for hamburger almost perfectly, having about 50 grams higher in the first three years and 200 grams higher in the last two years. In contrast, pizza had a sustained period of decline over the first 15 years, dropping by one-third from 300 to 100 grams. From 1985 to 1990, there was a slight increase by 10 grams; the curve crossed over with fish & chips’ at 210 grams in around 1982 and hamburger’s at 200 grams in 1988.
Top answer
Haran Taran In detail, the total consumption increased by 57%, from 430 to 1000 grams per week, over the 30-year period. In detail, the total per capita consumption more than doubled from 430 grams to 1 kilogram per week over the 30-year period.
- Haran Taran In detail, the total consumption increased by 57%, from 430 to 1000 grams per week, over the 30-year period.
- In detail, the total per capita consumption more than doubled from 430 grams to 1 kilogram per week over the 30-year period.
Get the Weekly English Kit 📬
New words, one handy idiom, and a 2-minute quiz — delivered to your inbox to keep your streak alive.
Haran TaranIn detail, the total consumption increased by 57%, from 430 to 1000 grams per week, over the 30-year period.
In detail, the total per capita consumption more than doubled from 430 grams to 1 kilogram per week over the 30-year period.
 Related Questions