
Please review my IELTS essay
The graph below gives information about car ownership in Britain from 1971 to 2007.
My essay:
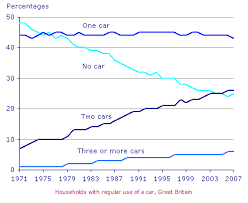
The line graph plots the proportion of households in the UK by the number of cars they owned between 1971 and 2007. Specifically, four curves are given: those who have no car, one car, two cars and three or more cars.
Overall, homes with one car had higher percentages than the other three categories from 1977 onwards. In contrast, the ones with three or more cars had the least throughout the period. Two curves, those without a car and the ones with two cars, were highly negatively correlated and crossed over in 2005. Car ownership increased as the significant drop in families without cars was more than offset by the rise in those with two cars or more.
In detail, the percentage of households who owned no car edged out the ones with at least one car in 1971, 52% versus 48%, nearly a 1:1 ratio. However, those without a car more than cut in half to 25% in 2007. So, the ratio was 1:3 at the end of the period. Nearly all of the increase in car ownership was attributed to the large increase in two-car families, which nearly quadrupled, from 7% to 26%, over the 36-year period. The ones having three or more cars also rose, from 1% to 6%, a sixfold increase. The percentages owing one car were in the narrow range between 43% and 45%.
Thank you a lot!!
Top answer
Did you copy from my sample essay? htm#sc2742145
- Did you copy from my sample essay?
- htm#sc2742145
Get the Weekly English Kit 📬
New words, one handy idiom, and a 2-minute quiz — delivered to your inbox to keep your streak alive.
Did you copy from my sample essay?
https://www.englishforums.com/English/CouldReviewIeltsWritingTask-Essay/bpxbgm/post.htm#sc2742145
 Related Questions