
Please review my IELTS essay
My essay:
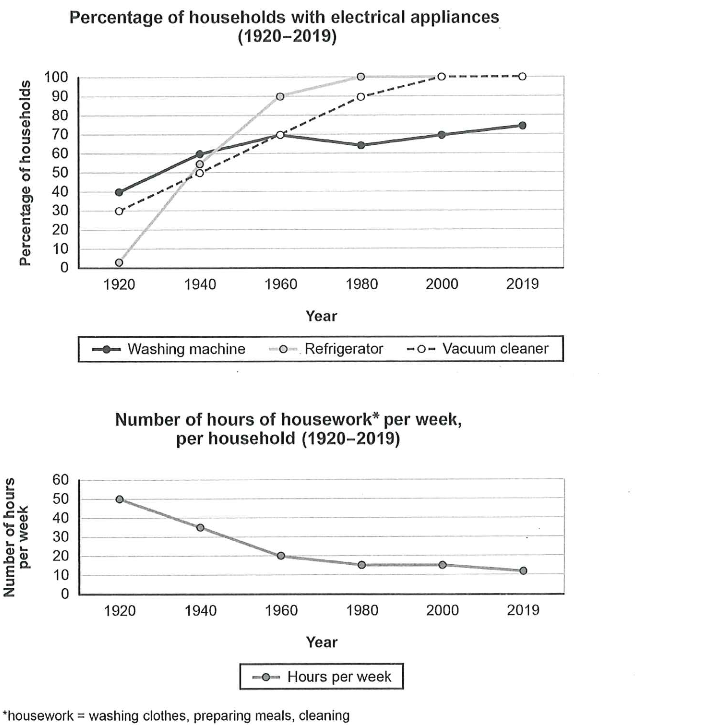
The line charts detail the shifts in households with electrical appliances, including washing machines, refrigerators, and vacuum cleaners, and the amount of time spent on doing housework in households weekly in a country from 1920 to 2019.
Overall, all electrical appliances become more popular, particularly refrigerators and vacuum cleaners. At the same time, there was a steady decline in the hours people spent doing housework.
In 1920, the washing machine was the most frequently used appliance in households, with a proportion of 40%. After that, its percentage climbed to 70% prior to a slight decrease of nearly 10% in 1980 and then recover to above 70% in 2019. There was a sharp increase in the ownership of refrigerators, beginning at nearly 0% in 1920, increasing to more than 50% by 1950, and then continuing to rise rapidly until peaking at 100% in 2019. Likewise, the proportion of vacuum cleaners rose continually from the beginning of the period. It started higher at more than 30% and grew remarkably to 100% in 2000.
The amount of time spent doing housework, by contrast, fell significantly from 50% to nearly 15% between 1920 and 1980. After that, its proportion remained stable before dropping slightly to 10% in 2019.
Top answer
Please read my advice for Task 1 essays: IELTS TASK 1: Hints, Tips And Advice Vocabulary Words For Task 1: Reference Post
- Please read my advice for Task 1 essays: IELTS TASK 1: Hints, Tips And Advice Vocabulary Words For Task 1: Reference Post
Get the Weekly English Kit 📬
New words, one handy idiom, and a 2-minute quiz — delivered to your inbox to keep your streak alive.
The line charts (wrong word) detail the shifts (that does not make sense. What is plotted on the graph?) in households with electrical appliances, including (This means that your list is not complete. You are giving a few examples.) w
 Related Questions