
Please review my Ielts essay.
The bar chart below shows the percentage of people in Great Britain living alone by age and sex in 2004/2005.
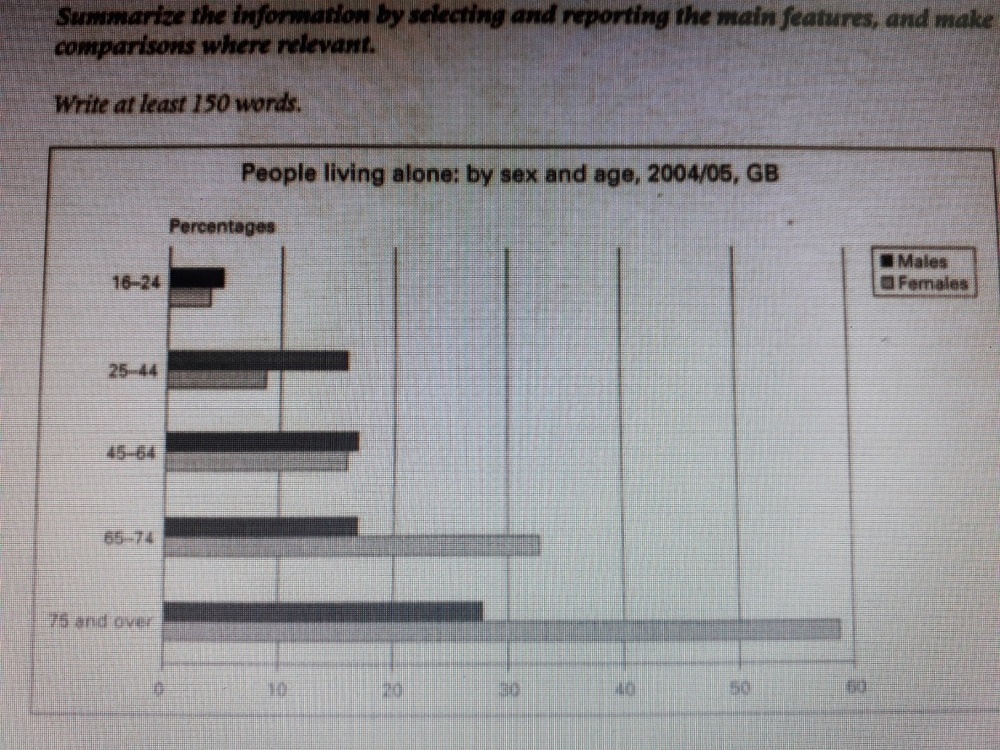
The bar chart plots the percent of males and females who stayed by themselves in Great Britain from 2004 to 2005 by age groups (16-24, 25-44, 45-64, 65-74, 75 and over).
In general, in age range 16-24, 25-44, 45-64 there were more men than women while 65-74, 75 and over age brackets were reserved and these two categories had the most people dwelling on their own.
As regards the first two groups, the percentage of males and females at the age of 25-44 (16 and 8% respectively) approximately tripled that of 16-24 and the percent of females was roughly one half compared to that of males. There was some similarity between the proportion of men aged between 25 and 44 and that of women within 45-64, whereas that of men from 45-64 was a little higher, about 17%, equaling that of men from 65-74. In age class 65-74, the number of females increased dramatically to 33%, doubling that of males, but it was moderate as opposed to 75 and over (just under 60%).
Top answer
) in Great Britain from 2004 to 2005 by age groups (16-24, 25-44, 45-64, 65-74, 75 and over). In general, in (Learn how to combine groups) age range 16-24, 25-44, 45-64 the three youngest groups (up to age 64), there were more men than women while it was the opposite in the two oldest groups 65-74, 75 and over age brackets were reserved (wrong word. ) and these two groups categories had the highest percentages.
- ) in Great Britain from 2004 to 2005 by age groups (16-24, 25-44, 45-64, 65-74, 75 and over).
- In general, in (Learn how to combine groups) age range 16-24, 25-44, 45-64 the three youngest groups (up to age 64), there were more men than women while it was the opposite in the two oldest groups 65-74, 75 and over age brackets were reserved (wrong word.
- ) and these two groups categories had the highest percentages.
- most people dwelling (Unnatural choice) on their own.
- As regards the first two groups, the percentage of males and females at the age of 25-44 (16 and 8% respectively) approximately tripled (Do not use the verb here, use the adjective.
Get the Weekly English Kit 📬
New words, one handy idiom, and a 2-minute quiz — delivered to your inbox to keep your streak alive.
The bar chart plots the percent of males and females who stayed by themselves (That does not mean the same thing as what is on the chart.) in Great Britain from 2004 to 2005 by age groups (16-24, 25-44, 45-64, 65-74, 75 and over).
In general, in (Learn how to combine groups) age range 16-24, 25-44, 45-64
 Related Questions