
Please Review My IELTS Essay.
The bar chart shows the highest qualification attained by sex for the working age population in Wales in 2001/2002. Summarise the information by selecting and reporting the main features, and make comparisons where relevant.
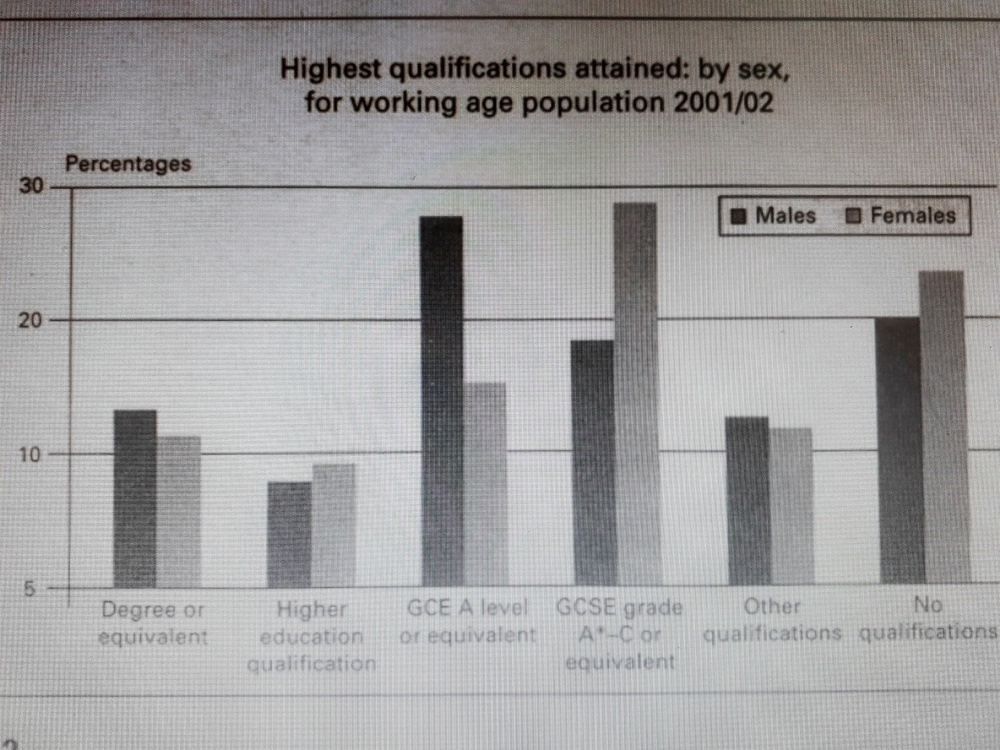
The bar chart plots the highest certificate that males and females have accomplished, including degree or equivalent, higher education qualification GCE A level or equivalent, GCSE grade A*-C or equivalent, other qualification and no qualification in Wales over a period of one year from 2001 to 2002 in percentage terms.
In general, there was not much difference between these two groups, except for the patterns of GCE A level or equivalent and GCSE grade A*-C or equivalent; however, the number of men and women were respectively the highest in these two qualifications compared to others.
The proportions of degree or equivalent and other qualification were approximately the same, above 10% with a tiny more males than females, while the reserve was true in higher education and no qualification categories as there were more females than males and the sum of the former was about a half of the latter (20% and 40%). The remaining ones: GCE A level or equivalent, GCSE grade A*-C or equivalent had a few analogies between the percentages of people, but for different categories. To elaborate, 28% men and 15% women obtained the GCE A level or equivalent whereas 29% women and 18% men got the GCSE grade A*-C or equivalent.
Get the Weekly English Kit 📬
New words, one handy idiom, and a 2-minute quiz — delivered to your inbox to keep your streak alive.
 Related Questions