
Please review my Ielts essay
Topic: The bar chart shows the average size class in primary schools and lower secondary schools
in 6 countries compared to the world average in 2006.
My essay:
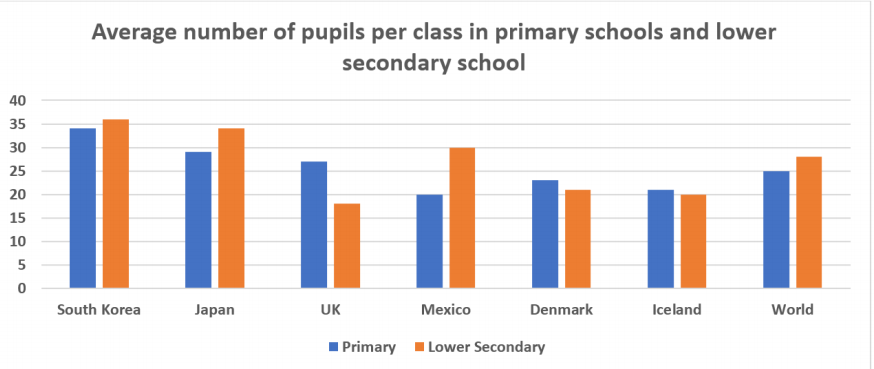
The bar chart compares the average number of pupils per class in primary and lower secondary schools in 6 different countries with the world average.
In general, two countries in Asia stood in the first position in the number of students. Additionally, both the average size class of Denmark and Iceland in two schools was lower than the world average.
The average size class of the world has students in lower secondary schools higher than primary schools. It was 28 and 25 pupils respectively. This trend also belonged to South Korea, Japan and Mexico. Pupils who studied in lower secondary schools were nearly similar in South Korea and Japan, with around 35 students. It was slightly lower in Mexico, with 30 pupils. South Korea and Japan still had the average size class in primary schools bigger than the world average of about 4-9 students. In contrast, Mexico just had 20 students in primary schools.
In Denmark and Iceland, students per class were average about 20 - 23 students for both primary and lower secondary schools. It was lower compared with the world. The UK had the smallest size class in primary schools, by under 20 students. But their figures for lower secondary schools was higher than the world average, by 27 students.
Top answer
The bar chart compares the average number of pupils per class in primary and lower secondary schools in 6 (Use digits and numerals for data values. ) six different countries with the world average. ) In general, two countries in Asia (The reader is confused because you have not named any countries.
- The bar chart compares the average number of pupils per class in primary and lower secondary schools in 6 (Use digits and numerals for data values.
- ) six different countries with the world average.
- ) In general, two countries in Asia (The reader is confused because you have not named any countries.
- ) had the largest class sizes.
- in the number of students .
Get the Weekly English Kit 📬
New words, one handy idiom, and a 2-minute quiz — delivered to your inbox to keep your streak alive.
The bar chart compares the average number of pupils per class in primary and lower secondary schools in 6 (Use digits and numerals for data values. If they are categories, use words.) six different countries with the world average. (What are the six countries?)
In general
The bar chart compares the class sizes of primary and lower secondary schools in six countries as well as the world averages. The countries shown are two in Asia (Korea and Japan), three in Europe (the UK, Denmark and Iceland), and one in Central America (Mexico).
Overall, class sizes in the European countries were lower than the world averages, with the one exception of UK primary schoo
 Related Questions