
Please review my IELTS essay
Topic : The line graph below shows the percentage of tourists to England who visited four different attractions in Brighton.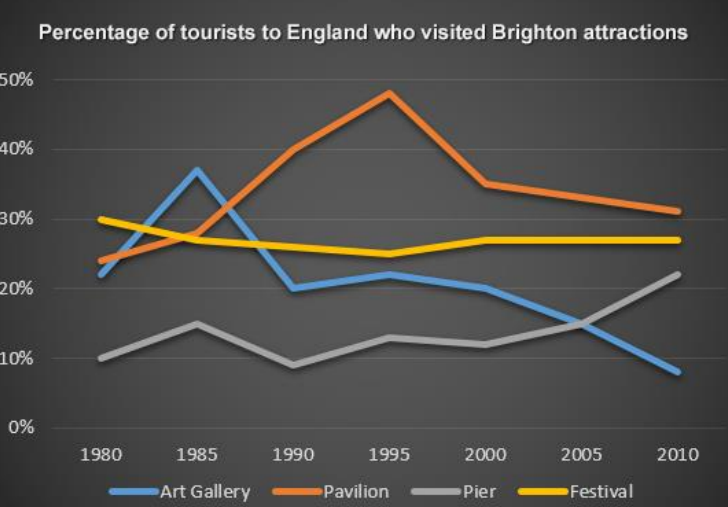
My essay:
The line graph indicates the proportion of tourists to England who visited four different attractions in Brighton : Art Gallery, Pavilion, Pier and Festival from 1980 to 2010.
In general, tourists visited Art Gallery and Festival decreased throughout the period. But the opposite was true for Pier and Pavilion. Additionally, the percentage of visitors visited Pavilion was highest almost the period.
In 1980, the most popular attraction for visitor to England was the Festival, by 30%. Then, Festival had a slight decrease to 28% in 2000 and remained unchanged till the end of the period. Meanwhile, the proportion of tourists visited Art Gallery peaked at 38% in 1985. Between 1985 and 2010, there was a dramatic decline and Art Gallery had the lowest percentage visiting, less than 10% in 2010. From 1980 to 1995, the proportion of tourists visited Pier was volatile, rose slightly to 12%. But with Pavilion, the percentage of visiting increased significantly, peaked at 49% in 1995. After that, it dropped to nearly 30% in 2010. In contrast, tourists visited Pier slowly increased to about 22% at the end of the period.
Get the Weekly English Kit 📬
New words, one handy idiom, and a 2-minute quiz — delivered to your inbox to keep your streak alive.
 Related Questions