
Please review my IELTS essay
Topic: The Three Pie Charts Below Show The Changes In Annual Spending By Local Authorities In Someland In 1980, 1990 And 2000. Summarise The Information By Selecting And Reporting The Main Features, And Make Comparisons Where Relevant.
My essay:
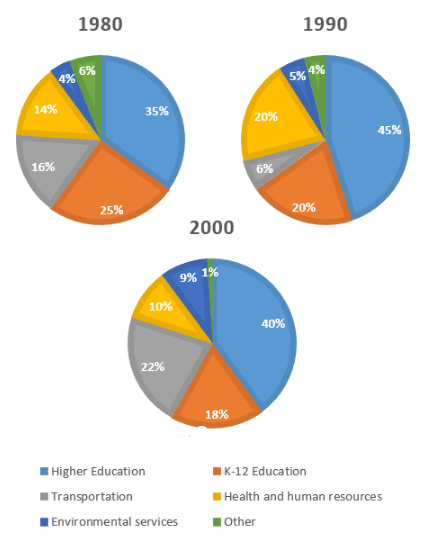
The pie charts compare the annual expenditure of the authorities in Someland in the years 1980, 1990 and 2000.
Overall, education which consist of higher education and K-12 education, took up the lion’s share of authorities spending with nearly three quarters of the total spending. Higher education expense rose significantly, from 35% in 1980 to 50% in 1990 before falling to 40% in 2000. In addition, 25 percent of authorities spending was held by K-12 education in 1980 which decreased by seven percent in 2000.
In 1980, the proportion of transportation spending decreased dramatically by ten percent in 1990 before expanding to 22% in 2000. A reversed pattern applied to health and human resources spending, increasing from 14% in 1980 to 20% in 1990, then cut it by a half by 2000. The smallest proportion of spending was represented by environment services spending and other spending , never exceeding a tenth of the authorities’ total expenditure.
Top answer
The pie charts compare the annual expenditure s of the authorities in Someland in six budget categories in the years 1980, 1990 and 2000. They are higher and K-12 education, transportation. environmental services, health and a miscellaneous category, other.
- The pie charts compare the annual expenditure s of the authorities in Someland in six budget categories in the years 1980, 1990 and 2000.
- They are higher and K-12 education, transportation.
- environmental services, health and a miscellaneous category, other.
- (You need to clearly identify the "main features" separate from the details.
- Avoid writing specific details in the "overall" paragraph.
Get the Weekly English Kit 📬
New words, one handy idiom, and a 2-minute quiz — delivered to your inbox to keep your streak alive.
The pie charts compare the annual expenditures of the authorities in Someland in six budget categories in the years 1980, 1990 and 2000. They are higher and K-12 education, transportation. environmental services, health and a miscellaneous category, other.
(You
 Related Questions