
Please review my IELTS essay
My topic:
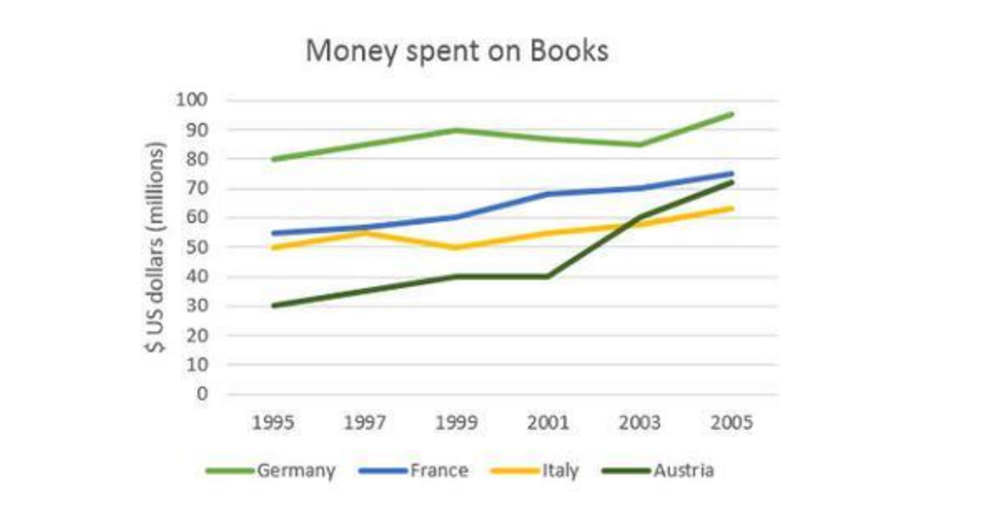
The graph below shows the amount of money spent on books in Germany, France, Italy and Austria between 1995 and 2005.
Write a report for a university lecturer describing the information below.
My essay:
The line chart compares the sum of money spent on books in four nations: German, France, Italy and Austria. Data points are shown for many years between 1995 and 2005.
Overall, people in German spent more money on books than people in the other three countries. However, spending on books increased in all nations over 10 years.
In 1995, people spent $80 millions on books in Germany. The amount of money on books in France and Italy is almost similar, $50 millions and $55 millions. And in Austria, only $30 millions spent on books. Although the amount of money in German decreased between 1999 and 2003, it was higher in the other countries during the period and it reach the peak in 2005, with $95 millions.
The spending on books in France increased steadily from $55 millions in 1995 to $75 millions in 2005. The amount of money spent on books Austria also increased slightly between 1995 and 2001, from $30 millions to $40 millions. However, it rose sharply from $30 millions in 2001 to nearly $75 millions in 2005, it was the highest amount of money spent on books in Austria. Despite the fluctuation, the spending on books in Italy reach its maximum was $63 millions in 2005.
Top answer
The line chart (There are pie charts, bar charts, Gantt charts, eye charts and flow charts, but there is no such thing as a line chart. ) compares the sum of money (unnatural) spent on books in four nations: German , France, Italy and Austria. Data points are shown for many years between 1995 and 2005.
- The line chart (There are pie charts, bar charts, Gantt charts, eye charts and flow charts, but there is no such thing as a line chart.
- ) compares the sum of money (unnatural) spent on books in four nations: German , France, Italy and Austria.
- Data points are shown for many years between 1995 and 2005.
- ) spent more money on books than people in the other three countries.
- However, spending on books increased in all nations over 10 years .
Get the Weekly English Kit 📬
New words, one handy idiom, and a 2-minute quiz — delivered to your inbox to keep your streak alive.
The line chart (There are pie charts, bar charts, Gantt charts, eye charts and flow charts, but there is no such thing as a line chart. ) compares the sum of money (unnatural) spent on books in four nations: German, France, Italy and Austria.
Sample Essay
The line graph compares the amounts of money, in millions of US dollars, that people in four countries (Germany, France, Italy and Austria) used to purchase books during the decade from 1995 to 2005.
Overall, the Germans spent the most, followed by the French. People allocated more money for book purchases in 2005 than they did in 1995, regardless of their nationality.
 Related Questions