
Please review my IELTS essay
Topic:
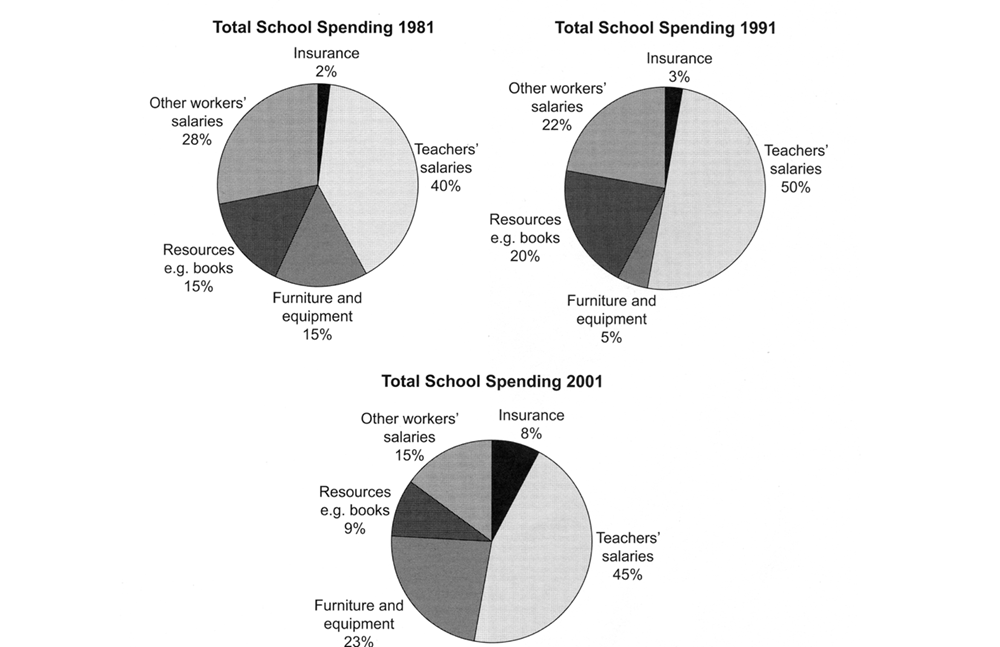
The three pie charts below show the changes in annual spending by a particular UK school in 1981, 1991 and 2001.
Summarise the information by selecting and reporting the main features, and make comparisons where relevant.
My essay:
The three pie charts compare the differences among the expenditures per year of a British school in a period of three years: 1981, 1991, 2001.
Overall, spending on teacher's salaries accounts for the highest percentage in all three years, 40%, 50%, and 45% respectively. In contrast, the cost of insurance had the lowest contribution in terms of money spending, only 2% in 1981, 3% in 1991, and 8% in 2001.
Expenditure on other workers' salaries saw a downward trend, declined from 28% in 1981 to only 15% of spending by the end of the period. Spending on resources e.g. books rise slightly by around 5% and then fall dramatically between 20% in 1991 and only 9% in 2001. Conversely, the cost of furniture and equipment went down to only 5% of total expenditure in 1991 and continued going up significantly in 2001, made up of 23% in the school budget.
Thank you for your kindness!
Top answer
You wrote exactly 150 words. It is better to write 170-190 to be on the safe side. The three pie charts compare the differences among the expenditures (That is not accurate.
- You wrote exactly 150 words.
- It is better to write 170-190 to be on the safe side.
- The three pie charts compare the differences among the expenditures (That is not accurate.
- g.
- 234,500 pounds sterling in 1981 versus 439,233 in 2001.
Get the Weekly English Kit 📬
New words, one handy idiom, and a 2-minute quiz — delivered to your inbox to keep your streak alive.
You wrote exactly 150 words. It is better to write 170-190 to be on the safe side.
The three pie charts compare the differences among the expenditures (That is not accurate. Differences of expenditures would be amounts of money, e.g. 234,500 pounds sterling in 1981 versus 439,233 in 2001. ) per year of a British school in a
 Related Questions