
Please review my IELTS essay
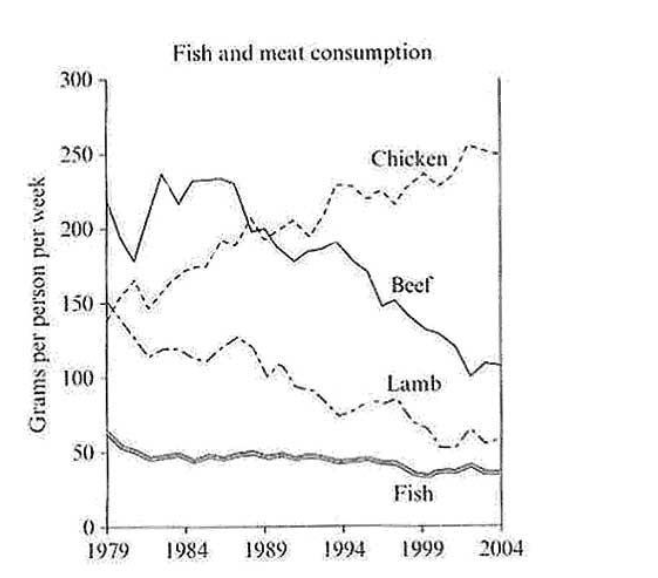
Topic: The graph below shows the consumption of fish and some different kinds of meat in a European country between 1979 and 2004.
Summarise the information by selecting and reporting the main features, and make comparisons where relevant
My essay:
The line graph compares the amounts of chicken, beef, lamb, and fish consumed in a European country over 25 years.
Overall, the consumption of beef and lamb declined, while there was an increasing amount of chicken that was eaten and fish consumption stayed nearly unchanged during the period shown. At first, beef was eaten the most; however, at the end of the period, the largest amount of chicken was consumed.
In 1979, the weekly consumption of beef was about 220 grams per capita. Each person ate beef and lamb in nearly the same quantity ( of 150 grams ). The figure for fish was the lowest, just some 60 grams.
Between 1979 and 2004, the amount of chicken consumed was the highest. It increased to around 250 grams. By contrast, beef and lamb consumption decreased to just over 100 grams and 60 grams respectively. Though there was a slight drop in the consumption of fish, it was the most stable.
Get the Weekly English Kit 📬
New words, one handy idiom, and a 2-minute quiz — delivered to your inbox to keep your streak alive.
 Related Questions