
Please review my IELTS essay
Topic: The bar chart shows the expenditure of two countries on consumer goods in 2010
My essay:
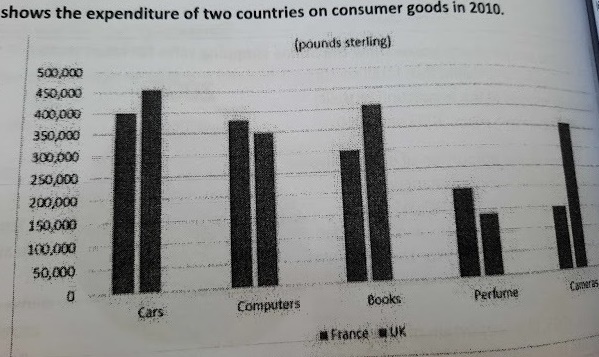
The bar chart depicts the expenses of the France and UK spent on five various types of goods, namely cars, computers, books, perfume, and cameras. Units are measured in pounds stealing throughout 2010.
On the whole, the 2010 period recorded that it took the UK noticeably more money on almost all consumer goods than the remaining country, except computers and perfume. Besides, cars had the highest statistics for both countries and perfume, by contrast, was the least in the same term. Also, the most significant disparities between those nations were on cars where France was outnumbered by far.
Looking at the chart in specific, just over 450,000 and exactly 400,000 pounds were paid for cars in France and UK respectively, in comparison to that of books which marginally gained less than at just over 400000 and around 300000 in the same order of countries as above. Furthermore, there was an overwhelming amount about cameras group at more than 350,000 was expended by the UK, which doubled that of France, at only around 150,000.
On the other hand, regarding computers where France picked a slightly larger, with its amount was barely 400,000 as opposed to perfume, it had a figure of precise 200,000 pounds paid by the UK.
Top answer
You are trying to write convoluted and complex sentences. It does not give you a good score. It will lower your score because the reader has difficulties understanding what you mean.
- You are trying to write convoluted and complex sentences.
- It does not give you a good score.
- It will lower your score because the reader has difficulties understanding what you mean.
- Write clear, direct and natural sentences.
- You should have three paragraphs: 1.
Get the Weekly English Kit 📬
New words, one handy idiom, and a 2-minute quiz — delivered to your inbox to keep your streak alive.
You are trying to write convoluted and complex sentences. It does not give you a good score. It will lower your score because the reader has difficulties understanding what you mean. Write clear, direct and natural sentences.
You should have three paragraphs: 1. Description of the bar chart, 2. main features, and 3. some detailed comparisons.
You need to review clauses and sentenc
 Related Questions