
Please review my IELTS essay
Topic: The line graph shows the cost for watching films. The pie charts show the change in the percentage of market share represented by the three forms.
Summarise the information by selecting and reporting the main features, and make comparisons where relevant.
My essay:
The infographic, consisting of a line graph and two pie charts, compare the amount of money paid for watching films in three different types, and the percentage split between those types in turn.
Overall, buying cinema tickets remainded the most expensive way to watch movies between 2005 and 2011. While the majority of market share was accounted for renting DVDs, there was a considerable increase in the propotion of watching online.
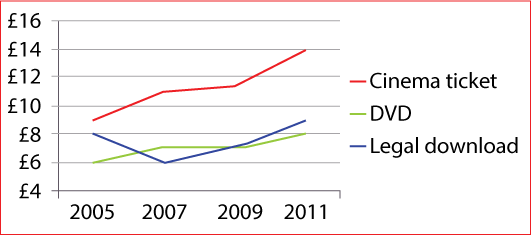
A cinema ticket cost around 9 pounds at the beginning, and rising by 5 pounds over a 6-year period to reach at 14 pounds. DVD prices also increased by 2 pounds, from 6 pounds in 2005 to 8 pounds in 2011. Downloaded movies were the cheapest format in 2007; however, the price went up gradually to 9 pounds by 2011.
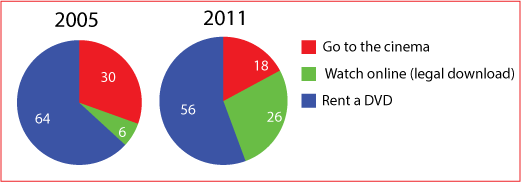
In 2005, around two-thirds of people hiring DVDs, compared to 30% and 6% of those going to the cinema and watching online respectively. In 2011, there was a fall in both renting and going to the cinema, whereas the percentage of downloaded movie made up by exactly a fifth of the market.
Get the Weekly English Kit 📬
New words, one handy idiom, and a 2-minute quiz — delivered to your inbox to keep your streak alive.
 Related Questions