
Please review my ielts essay
*Topic: 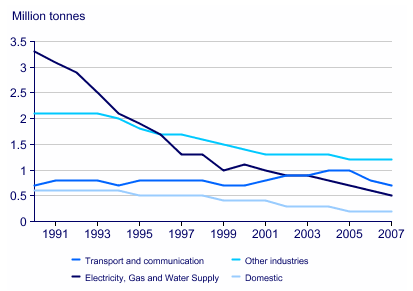
The Graph Below Shows UK Acid Rain Emissions, Measured In Millions Of Tonnes, From Four Different Sectors Between 1990 And 2007.
* My essay:
The provided line graph compares four sectors in terms of the amount of acid rain emissions produced by them over the period of 17 years in England. As is observed, the total amount of acid rain emissions saw a swift decline from 1991 to 2007.The most dramatic decrease was witnessed in electricity, gas and waste supply sector.
At the beginning of the period shown, the highest amount of waste came from electricity, gas and waste supply sector with 3,5 million tones As opposed to electricity, gas and waste supply area, domestic, transport and communication sectors produced well under one million tone. Other industries were responsible for just over two million tones.
In 2007, electricity, gas and waste supply fell speedily to only 0,5 million tone, a drop of about three millions. While domestic and other industries progressively reduce, there was a small growth in transport and communication sector, reaching a peak of one million tone in 2005.
Top answer
The provided line graph compares four sectors in England in terms of the amount of acid rain emissions produced by them over the period of 17 years starting in 1991. in England. As is observed, Overall, the total amount of acid rain emissions s aw a [ 1] swift significant decline from 1991 to 2007 for two of those sectors, whereas the other two had a moderate decline .
- The provided line graph compares four sectors in England in terms of the amount of acid rain emissions produced by them over the period of 17 years starting in 1991.
- in England.
- As is observed, Overall, the total amount of acid rain emissions s aw a [ 1] swift significant decline from 1991 to 2007 for two of those sectors, whereas the other two had a moderate decline .
- The most dramatic decrease was witnessed in the electricity, gas and waste supply sector.
- At the beginning of the period shown, the highest amount of waste acid rain came from was attributable to the electricity, gas and waste water supply sector with at 3.
Get the Weekly English Kit 📬
New words, one handy idiom, and a 2-minute quiz — delivered to your inbox to keep your streak alive.
The provided line graph compares four sectors in England in terms of the amount of acid rain emissions produced by them over the period of 17 years starting in 1991. in England. As is observed, Overall, the total amount of acid rain emissions
 Related Questions