
Please review my IELTS essay
Topic:
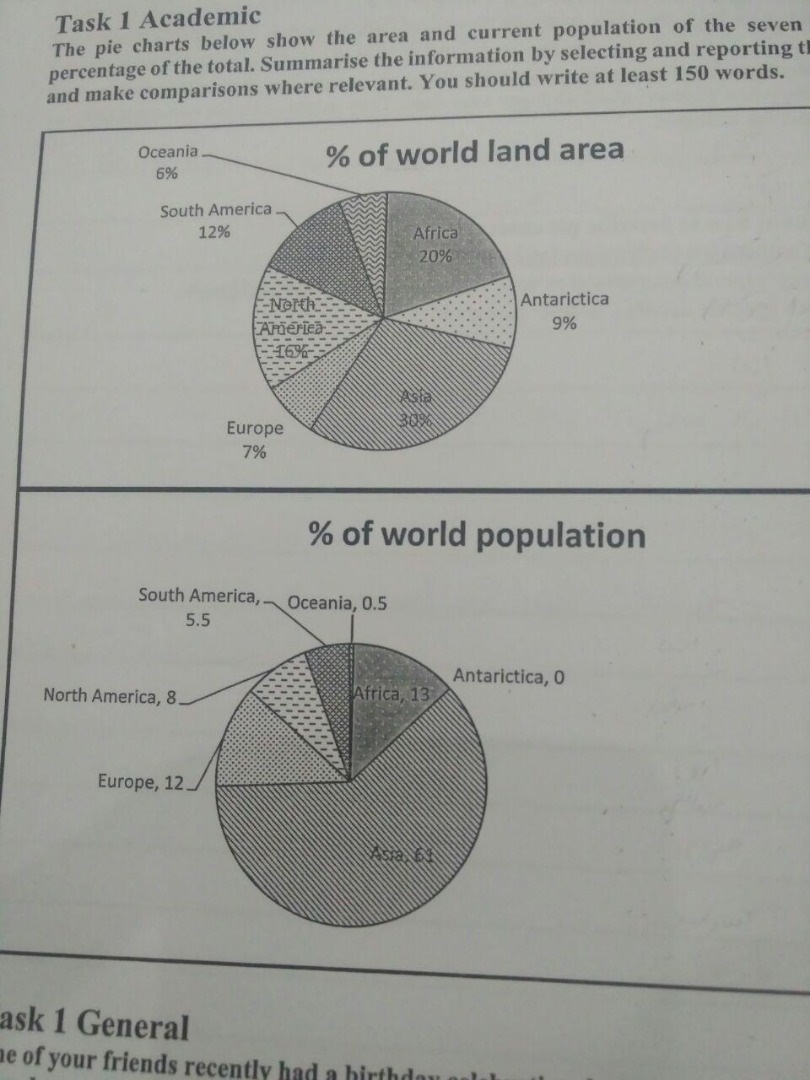
The pie chart below show the area and current population of the seven continent as a percentage of the total. Summarize the information by selecting and reporting the main features and make comparison where relevant.
My essay:
The given pie charts describe the percentage of area of the world and percentage of world population belonging to different continents.
Overall, Asia consist of the maximum percentage of world land area and also contain the more than half of world population. Furthermore, Antarctica is the emptiest continent and Asia is the most congested area of the world.
Although more than 60% of world population live in Asia, it just include less than one third of world land (30%). Likewise, 12 percentage of world population is for Europe which is greater than percentage of world land belong to this continent. Apart from Asia and Europe, for other continent percentage of world area is greater than percentage of world population.
Oceania has the minimum percentage of world land area, and include just 0.5% of world population. In addition Antarctica with about 9% of world land area has not any inhabitant. Africa in both categories is located at the second seat by 13% world population and 20% world land area. South and North America also contain 12 and 16 per cent world land area respectively which is about twice times of their percentage of world population.
Top answer
Topic: The pie chart below show the area and current population of the seven continent (wrong form) as a percentage of the total. Summarize the information by selecting and reporting the main features and make comparison where relevant. ) pie charts describe (wrong word) the percentage of area of the world and percentage of world population belonging to different continents.
- Topic: The pie chart below show the area and current population of the seven continent (wrong form) as a percentage of the total.
- Summarize the information by selecting and reporting the main features and make comparison where relevant.
- ) pie charts describe (wrong word) the percentage of area of the world and percentage of world population belonging to different continents.
- Suggestion: The two pie charts break down the land areas and population for the seven continents into percentages of the global totals.
- The seven continents are: Africa, Antarctica, Asia, Europe, Oceania and North and South America.
Get the Weekly English Kit 📬
New words, one handy idiom, and a 2-minute quiz — delivered to your inbox to keep your streak alive.
Topic:
The pie chart below show the area and current population of the seven continent (wrong form) as a percentage of the total. Summarize the information by selecting and reporting the main features and make comparison where relevant.
My essay:
The given (unnatural.) pie charts
 Related Questions