
Please review my IELTS essay
Topic: "The pie chart below shows the main reasons why agriculture land becomes less productive. The table shows how these causes affected three regions of the world during the 1990s. Summarise the information by selecting and reporting the main features, and make comparisons where relevant.
My essay
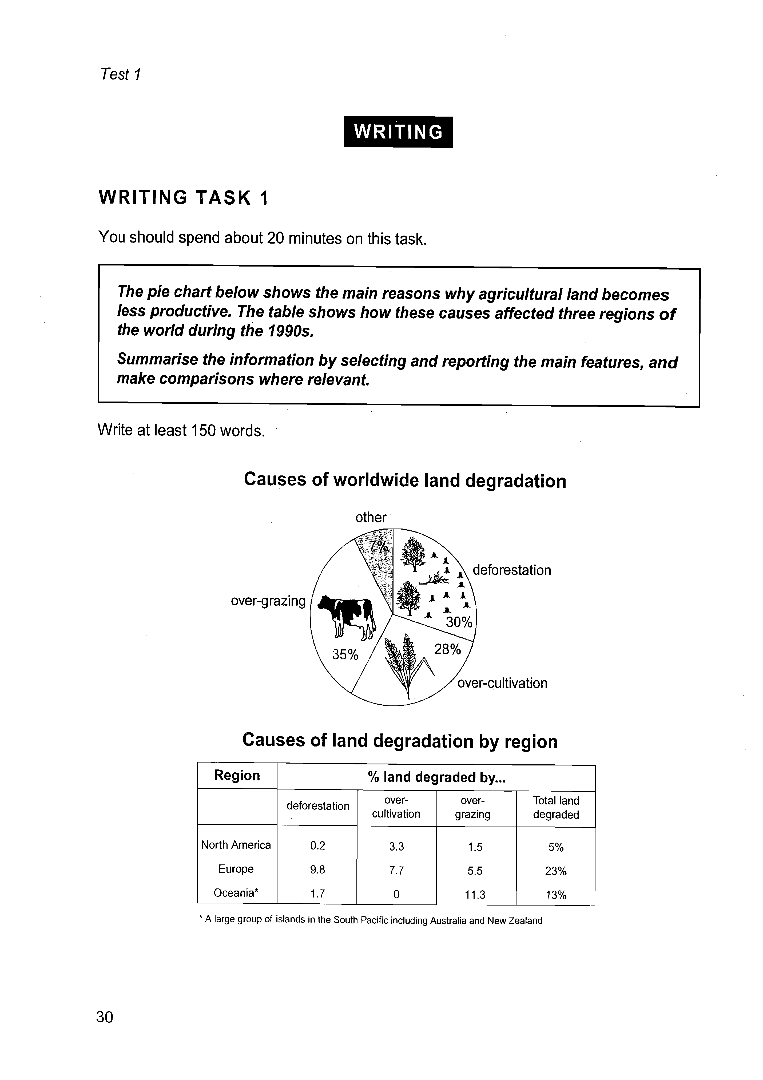
The pie illustrates the causes that lead to less efficiency in agriculture all over the world. The table reports the consequence that three regions in the world had to suffer from those reasons during the final decade of the 20th century.
Overall, the decrease on the protection of forests and over-grazing were two main factors resulting in land degradation. In the table, Europe, the most developed area, had the worst percentage in degraded land.
In the chart, over-grazing was the biggest factor which accounted for 35%. Forest destruction also contributed 30% of the reason to degradation. That figure of over-cultivation was only 2% lower than deforestation. Other causes shared the last 7%.
In terms of the table, during ten years, Europe experienced the worst situation in almost three aspect leading to 23% land degraded. Oceania was the second highest with 13%. Although there was no over-cultivation, Oceanian over-grazing was the worst. North America only had 5% degraded land, which was five times lower than the highest one.
Top answer
Topic: "The pie chart below shows the main reasons why agriculture land becomes less productive. The table shows how these causes affected three regions of the world during the 1990s. Summarise the information by selecting and reporting the main features, and make comparisons where relevant.
- Topic: "The pie chart below shows the main reasons why agriculture land becomes less productive.
- The table shows how these causes affected three regions of the world during the 1990s.
- Summarise the information by selecting and reporting the main features, and make comparisons where relevant.
- ) all over the world.
- The table reports the consequence that three regions in the world had to suffer from those reasons during the final decade of the 20th century.
Get the Weekly English Kit 📬
New words, one handy idiom, and a 2-minute quiz — delivered to your inbox to keep your streak alive.
Topic: "The pie chart below shows the main reasons why agriculture land becomes less productive. The table shows how these causes affected three regions of the world during the 1990s. Summarise the information by selecting and reporting the main features, and make comparisons where relevant.
My essay
The pie ( This is pie:
 Related Questions