
Please review my essay Writing Task 1
TASK 1: THE GRAPH BELOW SHOWS THE NUMBER OF ENQUIRIES RECEIVED BY TOURIST INFORMATION OFFICE IN ONE CITY OVER A SIX-MONTH PERIOD IN 2011
The line graph illustrates the number of inquiries sent t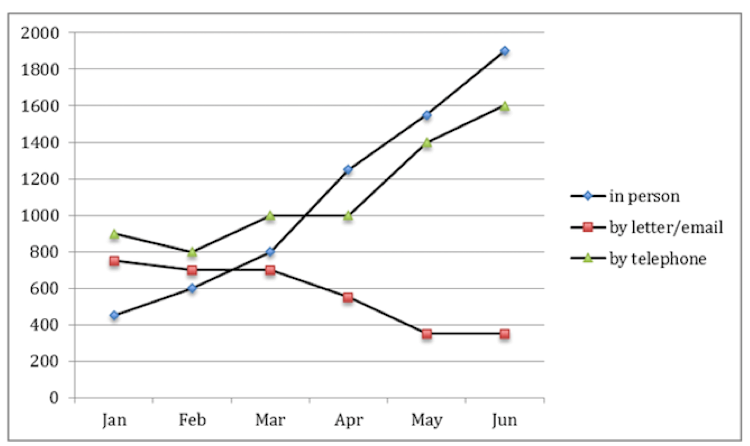
o the Tourist Information Office via three means of communication, from January to June in 2011.
It is clear that there was an upward trend found in the figure for in-person and via telephone. It is also worth nothing that written letters and emails came out on top regarding its speed.
In January, the Tourist Information Office received 900 telephone inquiries, while just under 800 letters and emails were received. Not many tourists chose to ask for information in person, with just over 400 queries. Over the next three months, the letters and emails still remained the most unpopular method for inquiries, at approximately 700 queries.
Meanwhile, the number of inquiries made in person saw considerable growth to 800, surpassing the figures for letters and postal inquiries. In addition, from March to June, there was a very similar pattern between the telephone and in-person enquiries. During this period, the number of inquiries in person soared by more than 1000 to peak at 1900, while there was also a significant rise in the figure for telephone enquiries, from 1000 to 1600. By contrast, fewer people sent emails and letters to make enquiries, with slightly under 400 in May and June.
Get the Weekly English Kit 📬
New words, one handy idiom, and a 2-minute quiz — delivered to your inbox to keep your streak alive.
 Related Questions