
Please review my essay. Thank you.
The charts below give information about USA marriage and divorce rates between 1970 and 2000, and the marital od adult Americans in two of the years.
Summarise the information by selecting and reporting the main features, and make comparisons where relevant.
My essay:
The two bar charts compare the number of American marriage and divorce rates between four decades (1970-2000), and show the marital status (never married, married, widowed and divorced) of the USA’s adults in two of the years (1970 and 2000).
Overall, it can be seen that the marriage rate has decreased steadily in these years, while the divorce rate has remained the same in 2000. In addition, the most of the adults were married in 1970 and 2000.
To begin, the number of married persons in the USA has decreased from 2.5 million in 1970 to 2 million in 2000, although this rate remained the same in the first decade. In comparison, the rate of divorces increased from 1 to 1.4 million until 1980 and then, the rate decreased to the same rate as 1970’s in 2000.
In 1970, the percentage of American married adults was the most status (70%) and it had about 10% decline in 2000. Never married adults who are very lower than the married adults (about 55% in 1970) ranked in second place. Also, widowed and divorced adults were under 10% in these years.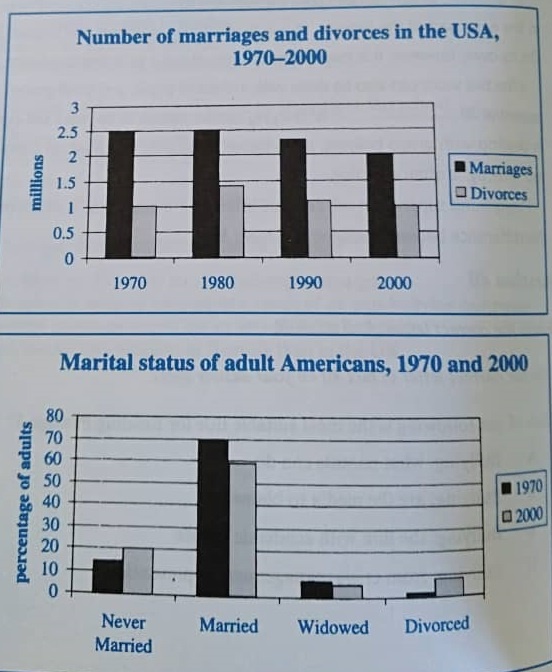
Top answer
You need to learn the vocabulary of mathematics and definition of mathematical terms such as "rate". Otherwise, your writing will be inaccurate. The two first bar chart s compares the number of American marriage and divorces over rates between four decades (1970-2000), and the second shows the marital status (never married, married, widowed and divorced) of the USA’s American adults in two of the years (1970 and 2000).
- You need to learn the vocabulary of mathematics and definition of mathematical terms such as "rate".
- Otherwise, your writing will be inaccurate.
- The two first bar chart s compares the number of American marriage and divorces over rates between four decades (1970-2000), and the second shows the marital status (never married, married, widowed and divorced) of the USA’s American adults in two of the years (1970 and 2000).
- (In general the two together give information about marriage and divorce rates, but neither one actually plots rates .
- Other related measures - number of marriages and divorces and marital status - are plotted.
Get the Weekly English Kit 📬
New words, one handy idiom, and a 2-minute quiz — delivered to your inbox to keep your streak alive.
You need to learn the vocabulary of mathematics and definition of mathematical terms such as "rate". Otherwise, your writing will be inaccurate.
The two first bar charts compares the number of American marriage and divorces over rates between four decades (1970-2000), and
 Related Questions