
Please Review My Essay Task 1
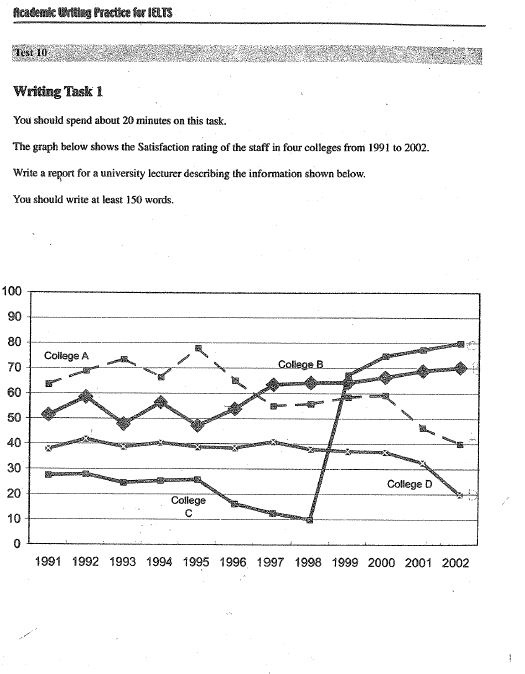
The line graph gives the satisfaction rating of the staff in four colleges between 1991 and 2002 on a percentage scale.
Overall, there was a downward trend in the rates of College A and College D. Meanwhile, the percentages of College B and College C grew dramatically over the same period.
In 1991, the rates of College A and College D started from approximately 62% and 40% respectively. While the percentage of College D gradually fell throughout the period, that of College A raised until 1995 when it reached a peak of 80%. In 2002, the satisfaction ratings of the staff in College A and College D remained 40% and 20%.
In contrast, the staff in College B and College C had growing satisfaction rates. From 50% in 1991, the rate of College B grew to 70% at the end of the period. Noticeably, there was a twofold increase in the percentage of College C. Beginning with the lowest percentage (nearly 30%), the satisfaction rates of the staff in College C rose to 80% in 2002.
(176 words)
Get the Weekly English Kit 📬
New words, one handy idiom, and a 2-minute quiz — delivered to your inbox to keep your streak alive.
 Related Questions