
Please Review My Essay (TASK 1)
The table given compares four different countries Canada, Japan, Peru, Zaire in terms of socio-economic criteria in 1994.
Overall, the proportion of Canada and Japan were considerably higher than those of the other shown. In addition, Zaire had the lowest figures for each of the factors.
Regarding annual income per person, Japan topped the table at 15760, followed by Canada (11100), Peru (160) and Zaire (130). Interestingly, while Japan took the highest place again at 78%, Canada came a close second at 76% with regard to life expectancy at birth. Also, the comparable figures for Peru and Zaire were more or less 50 years each.
Canadians each consumed 3326 calories, while the Japanese took in 2846 calories per day. The remaining figures for Peru and Zaire were 1927 and 1749 respectively. Whereas the two highest literacy rates were in Canada and Japan, with 99%, only 68% of people in Peru and 34% of those in Zaire were literate.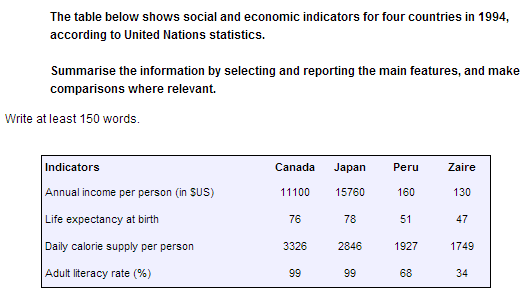
Top answer
The table given compares four different countries Canada, Japan, Peru, Zaire in terms of socio-economic criteria in (wrong word) 1994. Your first paragraph is inadequate. What specific data is shown?
- The table given compares four different countries Canada, Japan, Peru, Zaire in terms of socio-economic criteria in (wrong word) 1994.
- Your first paragraph is inadequate.
- What specific data is shown?
- The table gives four different statistics from Canada, Japan, Peru, Zaire, gathered by the United Nations.
- These four data points -- annual per capita income, life expectancy, adult literacy rates and daily per capita calories --- indicate the prosperity of the citizens and economic health of the nation.
Get the Weekly English Kit 📬
New words, one handy idiom, and a 2-minute quiz — delivered to your inbox to keep your streak alive.
The table given compares four different countries Canada, Japan, Peru, Zaire in terms of socio-economic criteria in (wrong word) 1994.
Your first paragraph is inadequate. What specific data is shown?
The table gives four different statistics from Canada, Japan, Peru, Zaire, gathered by the United Natio
 Related Questions