
Please review my essay for Task 1
Thank you in advance.
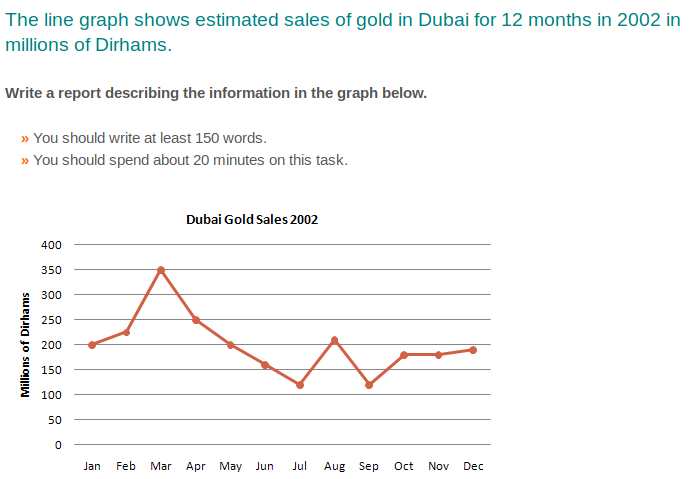
The line graph depicts the amount of Dubai gold sold monthly, in millions of Dirhams, for the year 2002.
Overall, from January to December of 2002, the sales of gold in Dubai had a great deal of variations with some peaks and troughs. Furthermore, the sales at the end of the year were slightly lower than the initial transaction value.
At the beginning of the year, about 200 million dirhams worth of gold were sold in Dubai. This value went up in the succeeding two months to peak at 350 million dirhams, before falling dramatically by more than 50% to its lowest level of just slightly over 100 million dirhams on July 2002. In the following month, the sales recovered and increased to 200 million, but just one month later, the sales dropped to 100 million dirhams again. From this point it rose to approximately 170 million and stabilized within the range of 170 to 180 million dirhams up to the end of the year.
Top answer
The line graph depicts the amount of Dubai gold (An amount of gold would be in grams. ) monthly, in millions of Dirhams, for the year 2002. It is better not to paraphrase the graph title if your sentence will not be accurate.
- The line graph depicts the amount of Dubai gold (An amount of gold would be in grams.
- ) monthly, in millions of Dirhams, for the year 2002.
- It is better not to paraphrase the graph title if your sentence will not be accurate.
- The estimated values of gold sales in Dubai for the year 2002 are plotted on the line graph.
- The units of measure is millions of Dirhams and the data values are monthly Overall, from January to December of 2002, the sales of gold in Dubai had a great deal of variation s in the range of 110 to 350 million Dirhams per month with two some peaks and two troughs.
Get the Weekly English Kit 📬
New words, one handy idiom, and a 2-minute quiz — delivered to your inbox to keep your streak alive.
The line graph depicts the amount of Dubai gold (An amount of gold would be in grams. For example 122,000 grams) sold (The values are estimated, not actual.) monthly, in millions of Dirhams, for the year 2002.
It is better not to paraphrase the graph title if your sentence will not be accurate.
The estimated values of gold sales in Dubai for the
 Related Questions