
Please review my essay for Task 1
I hate writing to tell you honestly. But in the past few days, because of your feedback, I'm inspired to write more. 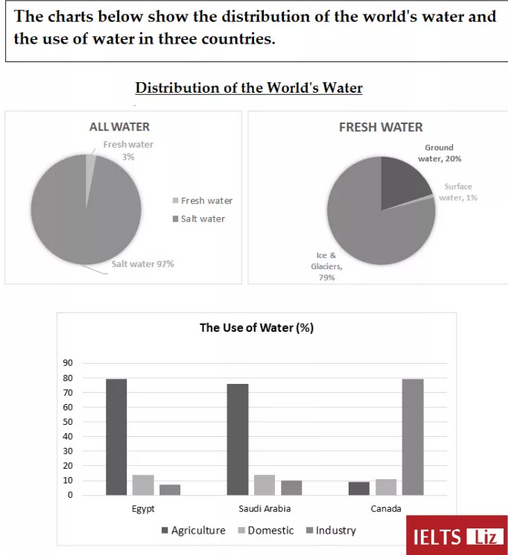
The bar graph depicts the water utilization of Egypt, Saudi Arabia and Canada, while pie charts compare the proportion of Salt and Fresh water globally. Fresh water is further divided into Ground water, Surface water and Ice and Glaciers.
Overall, Salt water accounts for the majority of water on Earth, while most of fresh water are in the form of ice and glaciers. Although Canada utilizes water primarily for the industries, both Egypt and Saudi Arabia mainly use water in agriculture.
Salt water comprises about 97% of all water in the world, while fresh water contributes only 3%. 79% of fresh water is in the form of ice and glaciers; about one-fifth is ground water, while only 1% is surface water.
Regarding water utilization in the 3 countries, approximately 79% in Egypt and 75% in Saudia are consumed in agriculture, while less than 20% is left for both domestic and industrial usage. The trend is reversed in Canada, where industry accounts for 80% of water usage and only 20% is utilized for combined domestic and agricultural consumption.
Top answer
jasondecastro while pie charts compare the proportion of Salt and Fresh water globally. Fresh water is further divided into Ground water, Surface water and Ice and Glaciers. "while pie charts": which pie charts?
- jasondecastro while pie charts compare the proportion of Salt and Fresh water globally.
- Fresh water is further divided into Ground water, Surface water and Ice and Glaciers.
- "while pie charts": which pie charts?
- "Pie charts" without an article means "pie charts in general".
- Also, why have you capitalized "Ground", "Surface", "Ice", and "Glaciers", when they in fact refer to these items in general?
Get the Weekly English Kit 📬
New words, one handy idiom, and a 2-minute quiz — delivered to your inbox to keep your streak alive.
jasondecastrowhile pie charts compare the proportion of Salt and Fresh water globally. Fresh water is further divided into Ground water, Surface water and Ice and Glaciers.
"while pie charts": which pie charts? "Pie charts" without an article means "pie charts in general". Also, why have you capitalized "Ground", "Surface", "Ice", and "Glaciers", when they
 Related Questions