
Please review my Essay for IELTS Task 1. Thanks a lot
Topic: The table and charts below give information on the police budget for 2017 and 2018 in one area of Britain. The table shows where the money came from and the charts show how it was distributed.
Summarize the information by selecting and reporting the main features and make comparisons when relevant.
My essay:
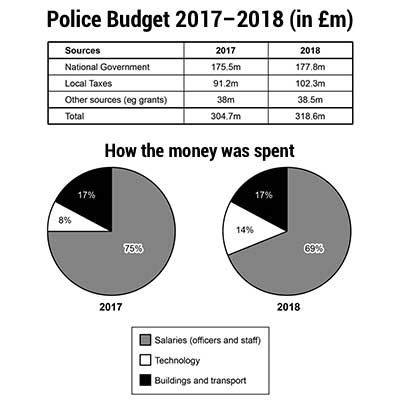
The table and charts show the budget for 2017 and 2018 spent on police in one particular region of Britain. The former gives figures on its sources and the latter on its distribution.
The most prominent contributor to the police budget is the National Government, spending 175.5 and 177.8 million pounds in 2017 and 2018, respectively. Local Taxes is the second major source of financial supply, which added 91.2 and 102.3 million in the aforementioned years. There were also other unspecified contributors, which amounted to 38 and 38.5 million in the same time span. Overall, the police budget in this area gained a slight increase between 2017 and 2018, going from 304.7 million to 318.6 million pounds.
Most of this money was spent on the payments of officers and staff, which accounted for 75 and 69 percent of the total budget, respectively. An amount of 17 percent was used on buildings and transport in both years, and the rest was spent on technology.
Top answer
The table and charts show the budget for 2017 and 2018 spent on police in one particular region of Britain. The former gives figures on its sources and the latter on its distribution. The introduction is not very coherent and cohesive.
- The table and charts show the budget for 2017 and 2018 spent on police in one particular region of Britain.
- The former gives figures on its sources and the latter on its distribution.
- The introduction is not very coherent and cohesive.
- "Former" and "latter" do not give a smooth progression of ideas.
- They force the reader to backtrack to earlier text.
Get the Weekly English Kit 📬
New words, one handy idiom, and a 2-minute quiz — delivered to your inbox to keep your streak alive.
The table and charts show the budget for 2017 and 2018 spent on police in one particular region of Britain. The former gives figures on its sources and the latter
 Related Questions