
Please review my essay
Topic :
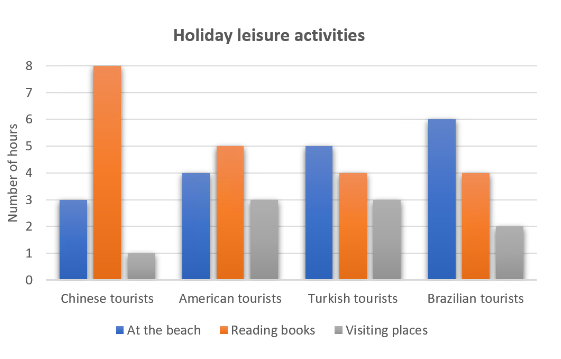
The chart shows the average number of hours each day that Chinese, American, Turkish and Brazilian tourists spent doing leisure activities while on holiday in Greece in August 2019.
Summarize the information by selecting and reporting the main features and make comparisons where relevant.
Write at least 150 words.
my essay:
The bar chart compares how many hours on average each day that tourists from four different countries spent on reading books, visiting places, and being at the beach in Greece. The data taken is in August 2019. In general, visiting places is the least favored by all tourists. In addition, the total sum of hours spent daily on the three activities are the same for each group
Visitors from China spent more time to read books (an average of 8 hours daily). Although not as much, Americans also had the same preference that they spent 5 hours on that. In contrary, those from America spent an hour more than Chinese when it comes to going to the beach.
Unlike the others, people from Turkey and Brazil allocated most of their time at the beach, even though Turkish spent an hour less than those from Brazil. In terms of reading books, both spent one-sixth of the day on average.
Top answer
The bar chart compares how many hours on average each day that tourists from four different countries spent on three activities: reading books, visiting places, and being at the beach in Greece. The data is from Greece in taken is in August 2019. The countries are China, the US, Brazil and Turkey.
- The bar chart compares how many hours on average each day that tourists from four different countries spent on three activities: reading books, visiting places, and being at the beach in Greece.
- The data is from Greece in taken is in August 2019.
- The countries are China, the US, Brazil and Turkey.
- ) In general, visiting places is the least favored by all tourists.
- Brazilian and Turkish tourists had very similar preferences in choosing to spend their free time.
Get the Weekly English Kit 📬
New words, one handy idiom, and a 2-minute quiz — delivered to your inbox to keep your streak alive.
The bar chart compares how many hours on average each day that tourists from four different countries spent on three activities: reading books, visiting places, and being at the beach in Greece. The data is from Greece in taken is in August 2019. The count
 Related Questions