
Please review my essay
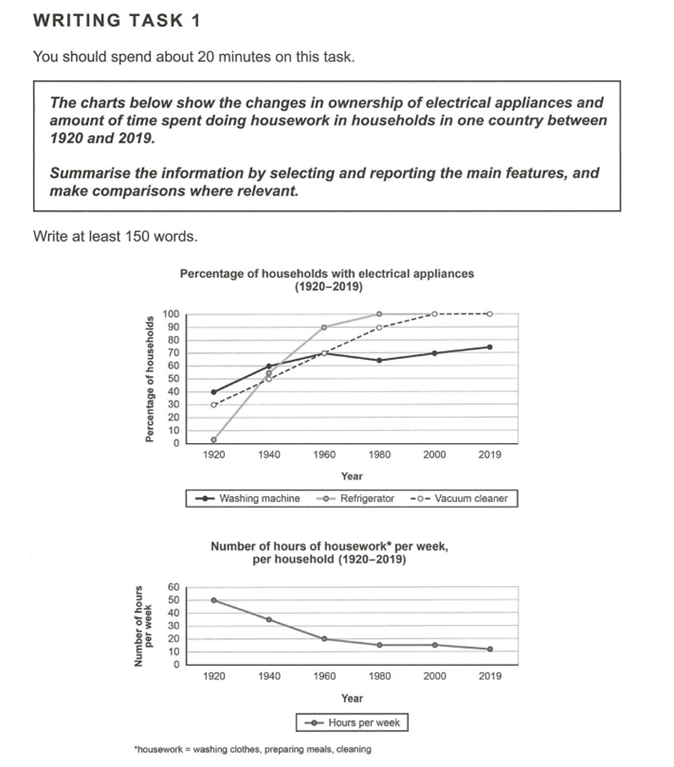
The first line chart gives the proportion of houses possessing three different kinds of electrical furniture, namely washing machine, refrigerator, and vacuum cleaner during the period from 1920 to 2019. The second line chart compares the weekly number of hours they used for household chores over the period.
Overall, there is a significant increase in ownership of the number of all the electrical devices, therefore, people spent less time doing household works during the years.
In 1920, a third household had vacuum cleaners and 10% higher than the former owning washing machine while the proportion of people possessing fridge was insignificant in comparison, nearly none. However, by 1960, there is a rocket in refrigerator ownership, overtaking two other devices when it reached 90%, higher than the proportion of vacuum cleaners and washing machines both standing at 70%. At the end of the period, fridge and vacuum cleaner became an indispensable device in each home, whereas roughly three fourth of households had washing machine although its percentage dropping to 65% in 1980. Regarding the housework time per week, its initial number was five times as much as the amount spent in 2019, 50 hours compared to 10 hours.
Top answer
) gives the proportion of houses households possessing three different kinds of electrical furniture , (Furniture is tables, chairs, desks, sofas and cabinets. ) namely washing machine, refrigerator, and vacuum cleaner during the period from 1920 to 2019. The second line chart compares the weekly number of hours they used for household chores over the period.
- ) gives the proportion of houses households possessing three different kinds of electrical furniture , (Furniture is tables, chairs, desks, sofas and cabinets.
- ) namely washing machine, refrigerator, and vacuum cleaner during the period from 1920 to 2019.
- The second line chart compares the weekly number of hours they used for household chores over the period.
- Overall, there is a significant increase in ownership of the number of all the appliances electrical devices , (comma splice error) therefore , (Do not write deductions, conclusions or inferences in Task 1) people spent less time doing household works during the years.
- In 1920, a third household (Wrong expression.
Get the Weekly English Kit 📬
New words, one handy idiom, and a 2-minute quiz — delivered to your inbox to keep your streak alive.
The first line chart (There is no such thing as a line chart.) gives the proportion of houses households possessing three different kinds of electrical furniture, (Furniture is tables, chairs, desks, sofas and cabinets. Incorrect word.)
 Related Questions