
Please review my essay
The chart below shows the number of jobs in tourism-related industries in one UK city between 1989 and 2009.
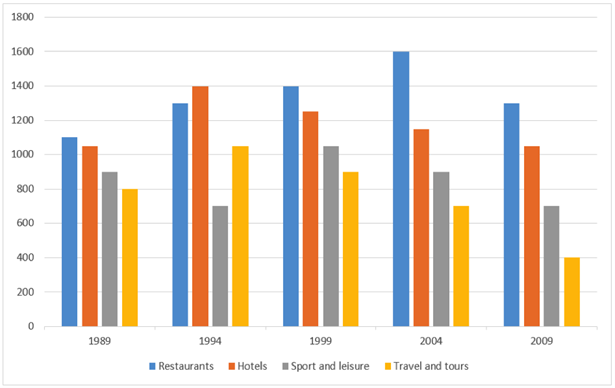
The bar chart compares the distribution of employment in four different tourism-related industries in one UK city during the period from 1989 to 2009. They include restaurants, hotels, sport and leisure, travel and tours.
Overall, restaurants provided majority of related jobs, followed by hotels, sport and leisure, travel and tours. This order did not change over the years excepted for 1994.
In 1989, restaurants registered the highest starting point, with 1100 jobs provided for city. This number significantly increased to reach the peak at 1600 jobs in 2004 despite also dipping to 1300 after five years. Furthermore, hotel recorded the second largest number of jobs through the period, at 1010 jobs in 2009, with an exception to the year 1994, as it had 1400 jobs to overtake the leading position.
The volumes of job-related travels and tours also had a comparable trend to the latter, growing considerably in the first 5 years before gradually falling to 400 in 2009. Regarding sport and leisure, its number fell from 900 to 660 in 1994, and then rose sharply to 1005 before dropping to 1994’s level.
Thank you for your seeing.
Top answer
The bar chart compares the distribution of employment in four different tourism-related industries in one UK city during the period from 1989 to 2009. They include restaurants, hotels, sport and leisure, and travel and tours. Overall, restaurants provided the highest number majority ( Majority is more than 50%.
- The bar chart compares the distribution of employment in four different tourism-related industries in one UK city during the period from 1989 to 2009.
- They include restaurants, hotels, sport and leisure, and travel and tours.
- Overall, restaurants provided the highest number majority ( Majority is more than 50%.
- ) of related jobs, followed by hotels, sport and leisure, and travel and tours.
- This order did not change over the years except ed for 1994.
Get the Weekly English Kit 📬
New words, one handy idiom, and a 2-minute quiz — delivered to your inbox to keep your streak alive.
The bar chart compares the distribution of employment in four different tourism-related industries in one UK city during the period from 1989 to 2009. They include restaurants, hotels, sport and leisure, and travel and tours.
Overall, restaurants provided the highest number majority ( Majority i
 Related Questions