
Please review my essay
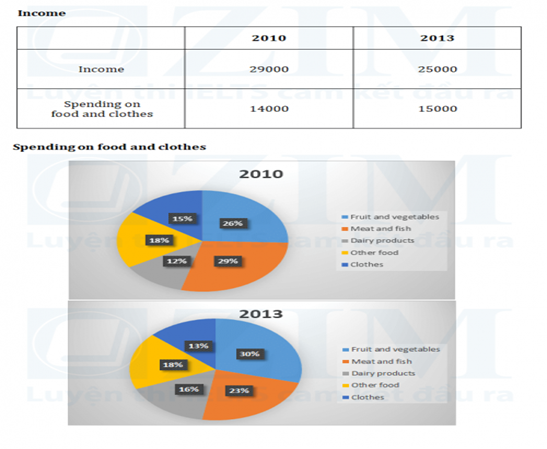
The pictures show information about average income and spending on food and clothes by an average family in a city in the UK.
The table compares how much money a British household earned and paid for the food and clothes on average while the accompanying pie charts plot the proportion of expenditure on five different categories in two separate years 2010, 2013.
Overall, the total amount of income decreased between 2010 and 2013 while the money allocated for food and clothes actually increased, with more fruit and vegetables and less meat and fish.
In 2010, an average family earned approximately 30.000 while this amount fell a further 4000 to 25.000 after 3 years. In contrast, the amount of money spent on food and clothes rose slightly from 14000 to 15000 during the period. To be more specified, although 18% of income was expensed for other food, as well as a modest decline of 6% from 29% to 23% in terms of expenditure on fish and meat, British families averagely spent more 4% than before on fruit and vegetables, at 26% in 2010 and 30% in 2013 respectively. Moreover, the proportion trend for dairy foods was also similar, a 4% increase from 12% to 16%. In contrast, 15% of the money was used for clothes in 2010 compared to a modest 13% in 2013.
Get the Weekly English Kit 📬
New words, one handy idiom, and a 2-minute quiz — delivered to your inbox to keep your streak alive.
 Related Questions