
Please review my essay
Topic: The chart below shows the percentage of people of different age groups who went to cinema once a month or more in one European country from 2000 to 2011.
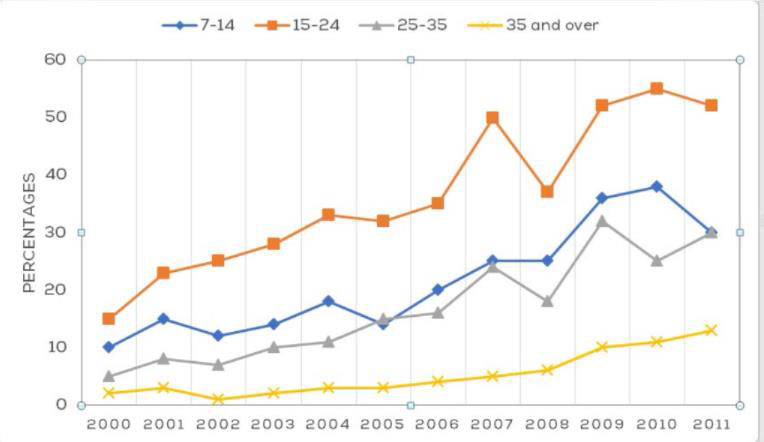
The line graph compares the proportion of Europeans who attended cinema every month over a 12-year period (2000-2011) split by age.
Overall, the 15-24 age group was the highest level of cinema In 2000, 15% of people aged 15 to 24 went to cinema, while the figure for the youngest age group was lower, at 10%. The percentage of the 15 to 24-year-olds surged dramatically just over three times in 2015, at about 50%, despite a small drop to 35% in 2008. The figure for the youngest age group fluctuated around 15%, then this figure grew to reach a peak at 35% in 2010 before declining moderately to 30% in 2011. Turning to two remaining groups, the 25-35 age group’s attendance at cinema increased gradually from about 5% in 2000 to 30% in 2011, equal to that of the youngest age group. Similarly, the oldest age group rose from 1% to just above 10% over the period shown.goers, while the oldest group’s attendance was the lowest. In addition, the greatest increase in cinemagoer levels was recorded for the 15 to 24-year-olds.
Get the Weekly English Kit 📬
New words, one handy idiom, and a 2-minute quiz — delivered to your inbox to keep your streak alive.
 Related Questions