
Please review my essay
The chart show the main reasons for study among students of different age groups and the amount of support they received from employers.
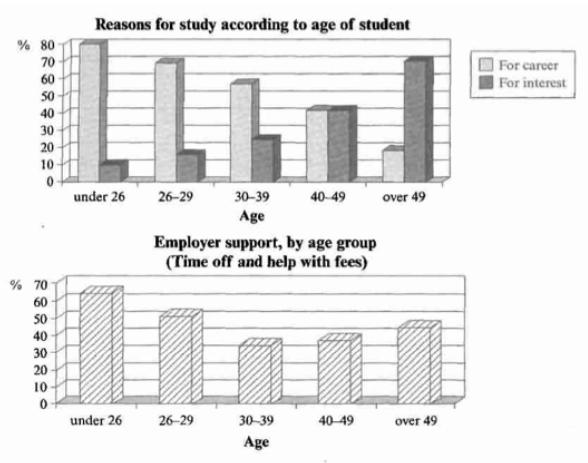
The first bar chart plots the percentage of people with different ages studying for two reasons namely for career and for interest. The groups of ages are: under 26, 26-29,30-39, 40-49 and over 49. The second chart compares how much support employers gave these people.
Overall, while the proportion of people studying for career decreases gradually, that of people studying for interest shows a completely opposite trend. The amount of support given to people studying for career is higher than that of people studying for interest.
Nearly 80% of students under 26, study for their career, which is eight times higher than that of students with interest reasons. In the groups of ages 26-29 and 30-39, the proportion of people studying for interest grows to about 15% and 25%, respectively, at the expense of 10% and 15% decline of students with career reasons. In the group 40-49 the percentages are equal. And in late adulthood, the proportion of people with interest reasons is more than triple that of people with career reasons.
Employer support is maximum (above 60%) for the under 26 year old students, it sinks sharply to about 32% in the group of middle-aged people. Subsequently, it rises modestly up to around 43% in late adulthood.
Top answer
The first bar chart plots the percentage of people of with different ages who gave one of studying for two reasons for attending classes, namely for career and for interest. The groups of ages are: under 26, 26-2 9,30 -39, 40-49 and over 49. The second bar chart compares how much support employers gave these the people in each age group .
- The first bar chart plots the percentage of people of with different ages who gave one of studying for two reasons for attending classes, namely for career and for interest.
- The groups of ages are: under 26, 26-2 9,30 -39, 40-49 and over 49.
- The second bar chart compares how much support employers gave these the people in each age group .
- Overall, while the proportion of people studying for their career decreases gradually as they age, that of people studying for interest shows a completely the opposite trend.
- The amount of support employers give to people studying for career is higher than that of people studying for interest.
Get the Weekly English Kit 📬
New words, one handy idiom, and a 2-minute quiz — delivered to your inbox to keep your streak alive.
The first bar chart plots the percentage of people of with different ages who gave one of studying for two reasons for attending classes, namely for career and for interest. The groups of ages are: under 26, 26-2
 Related Questions