
PLEASE REVIEW MY ESSAY
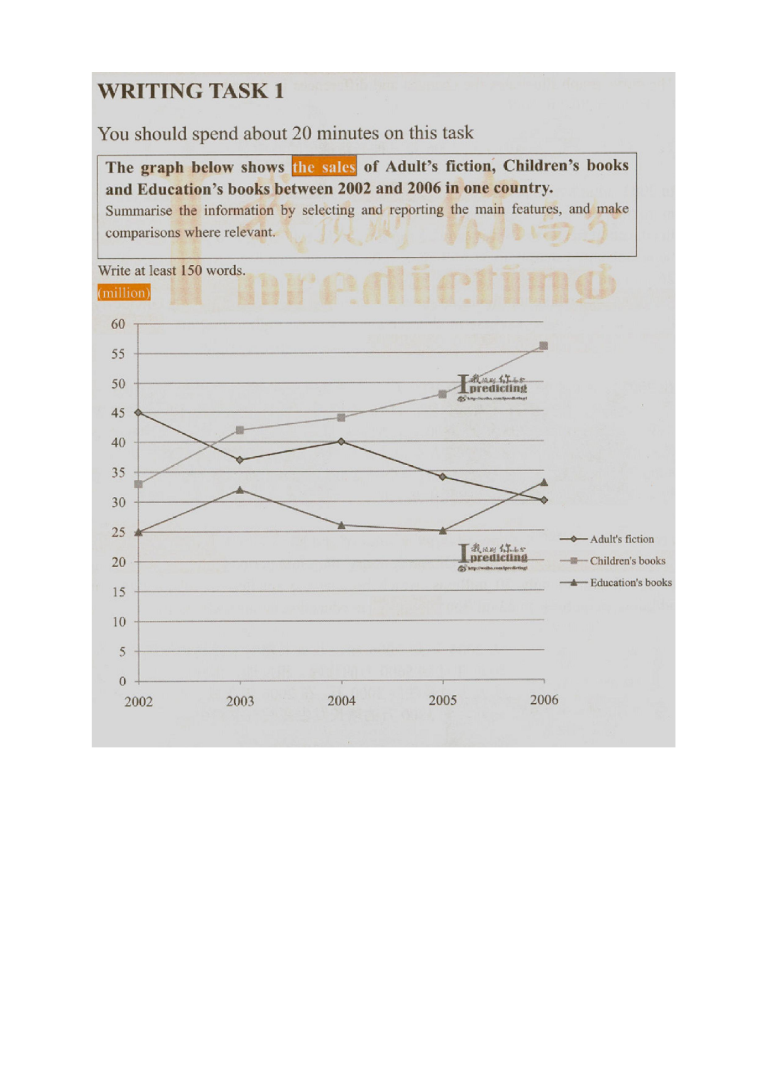
The line graph indicates the consumption of 3 kinds of book: adults’fiction, children’book and education’book in one country from 2002 to 2006.
Over all, it is clear that children’book has the sales higher than the other 2 types of book.
Frist of all, there is significant increase of con sumption of children and education’s book in 4 years. In 2002, the book sold out was 33 milions and there was sharply increase to around 51 milions in 2006. The consumption of education’book has fluctuated between 25 and 33 milions from 2002 to 2006.
By contrast, the consumption of adult’s fiction complete opposite with 2 rest types of book. The aldult’s fiction sold out in 2002 was considerable high at 45 milions and there was slightly rise from 37 to 40 before the consumption decreased to 30 milions in 2006
Top answer
Please post essays in the essay forum so a moderator does not have to move your post. htm
- Please post essays in the essay forum so a moderator does not have to move your post.
- htm
Get the Weekly English Kit 📬
New words, one handy idiom, and a 2-minute quiz — delivered to your inbox to keep your streak alive.
Please post essays in the essay forum so a moderator does not have to move your post.
https://www.englishforums.com/English/EssayReportCompositionWriting/Forum9.htm
The line graph indicates (shows / plots / depicts) the consumption ( Wrong word. We do not eat books. They do not taste very good. ) of 3 kinds of book: (wrong form) adults’fiction,
 Related Questions