
Please review my essay.
According to the chart, which English-speaking country do foreign students want to study in?
Write at least 100 words.
My answer: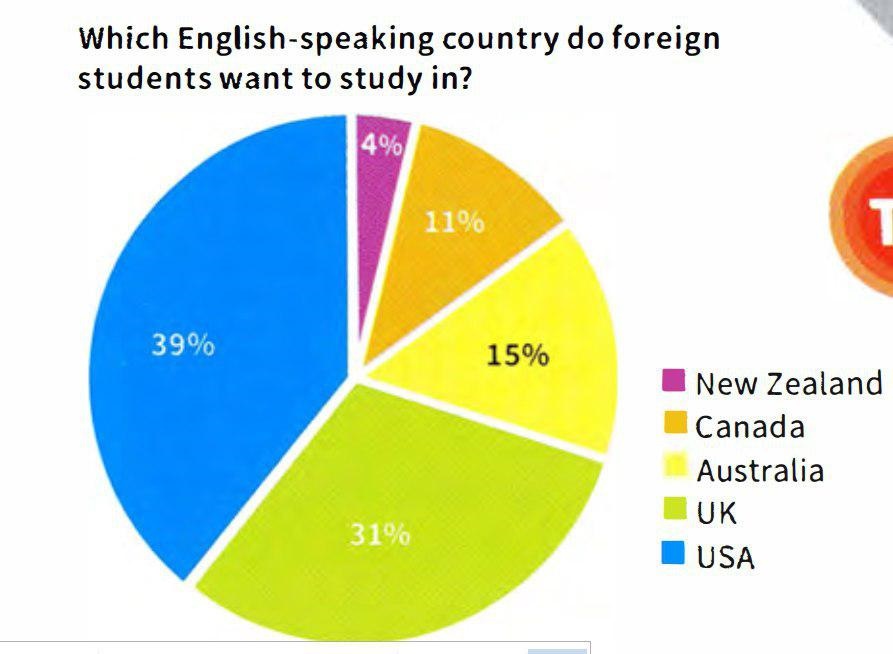
The pie chart presents the percentage of international students who want to study in a English-speaking country. As shown, there are several countries that are at the center of attention.
The first thing to notice is that the USA, in the west of the world, is the most popular country. Over a third percent of the overseas students want to study there. The UK from the Europe, is the country in the second place with a little under a third percent of popularity. That is remarkable that Canada, in the America's neighborhood, is in the forth place in this chart.
The third rank belongs to Australia, west of the world. Another eastern country in the chart is New Zealand. Few international students tend to go there, just under a sixth. In comparison, he proportion of Australia's applicants to New Zealand is about on in three.
It is clear that, the sum of western countries have the largest number of applicants.
Top answer
The pie chart presents the percentage of international students who want to study in a n English-speaking country , namely, New Zealand, Canada, Australia, the UK and the USA. As shown, there are several countries that are at the center of attention. ) is the most popular country.
- The pie chart presents the percentage of international students who want to study in a n English-speaking country , namely, New Zealand, Canada, Australia, the UK and the USA.
- As shown, there are several countries that are at the center of attention.
- ) is the most popular country.
- Over a third percent of the overseas students want to study there.
- The UK from the Europe, is the country in the second place with a little under a third percent of the student population popularity .
Get the Weekly English Kit 📬
New words, one handy idiom, and a 2-minute quiz — delivered to your inbox to keep your streak alive.
The pie chart presents the percentage of international students who want to study in an English-speaking country, namely, New Zealand, Canada, Australia, the UK and the USA. As shown, there are several countries that are at the center of attention. (This sentence doesn't communicate anything; you shoul
simsim937The pie chart presents the percentage of international students who want to study in a English-speaking country.
That is not what the chart shows.
Your sentence would mean that the chart shows, for example, 40% want to study in an English-speaking country and 60% do not want to study in an English-speaking country.
 Related Questions