
Please review - IELTS Writing task 1
Writing Task 1:
You should spend about 20 minutes on this task.
The chart below gives attendance figures for Grandville Stadium from 2017, which are projected through 2030 after a major improvement project.
Summarize the information by selecting and reporting the main features, and make comparisons where relevant.
Write at least 150 words.
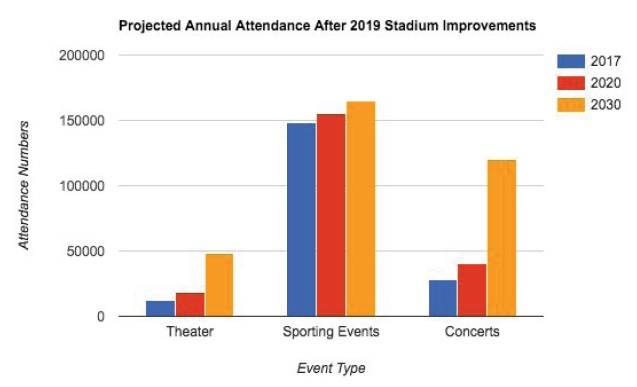
The bar chart shows the number of people attending the Grandville Stadium in 2017 for various events. It also has projections for the years 2020 and 2030 based on the attendance of 2017 and considering an important stadium betterment project. It is seen in both the actuals and the projections that a huge number of visitors are seen and expected for the sporting events.
The attendance numbers for the year 2017 shows about 5000 visitors to what the theater events. About 150 thousand people come to see the sporting events at the Stadium. This number plummets to a low of 30 thousand for the concerts.
The projection for the years 2020 and 2030 show an increase in the numbers for all three event types. Although the increase is huge in 2030, there is an increment in the projection for the year 2020 as compared to 2017 for the theater event. Sporting events is predicted to have a steady rise in the numbers through 2020 till 2030. A dramatic growth in the numbers is seen for the concerts in the decade starting 2020.
Top answer
The bar chart shows the number of people attending the Grandville Stadium in 2017 for various (three types of) events. It also has projections for the years 2020 and 2030 based on the attendance of 2017 and considering an important stadium improvement betterment project. It is seen in both the actuals and the projections that a huge (too informal) number of visitors are seen and expected for the sporting events.
- The bar chart shows the number of people attending the Grandville Stadium in 2017 for various (three types of) events.
- It also has projections for the years 2020 and 2030 based on the attendance of 2017 and considering an important stadium improvement betterment project.
- It is seen in both the actuals and the projections that a huge (too informal) number of visitors are seen and expected for the sporting events.
- The attendance numbers for the year 2017 shows about 5000 visitors to what the theater events.
- About 150 thousand people come to see the sporting events at the S tadium.
Get the Weekly English Kit 📬
New words, one handy idiom, and a 2-minute quiz — delivered to your inbox to keep your streak alive.
The bar chart shows the number of people attending the Grandville Stadium in 2017 for various (three types of) events. It also has projections for the years 2020 and 2030 based on the attendance of 2017 and considering an important stadium improvement betterment project. It is seen in both the actuals and the projections that a
Please review my answer for the same question
The bar graph Illustrates number of people attending Grandville Stadium for three different types of events that are Theater, Sporting Events and Concerts . The estimate is made for the year 2017 and based on it further projections are made for 2020 as well as 2030 and considering the stadium development project. Based on all factors, t
 Related Questions