
Please review and score my Writing Task 1 essay.
The line graph represents the waste amounts disposed of by three companies: A, B and C over the period from 2000 to 2015.
As can be seen, both company B and C had a growing amount of waste. However, simultaneously, both company A and B saw some dips.
From the start in 2000, company A was the company which touched the highest point at 12 tonnes of waste. At the same time, C jumped off the minimum amount at more than 3 waste tonnes. By contrast to its original level, in 2015, this company peaked at above 9 tonnes of waste in the amounts of waste dumped. Company B got rid of the least tonnes of waste at the end of the adjustment period with 3 waste tonnes.
In the middle of the searched period, the discharged waste amount of company C had been exaggerating more and more sharply every period of 5 years before reaching its high at last. The company B’s disposal of waste just reached its peak at roughly 10 tonnes in 2005 then plummeted (or reduce its waste) more and more respectively every 5 years. Company A, which had the largest amount of waste in 2000, had a decreasing amount at frankly 11 waste tonnes in 2005 and 9 tonnes by 2010. 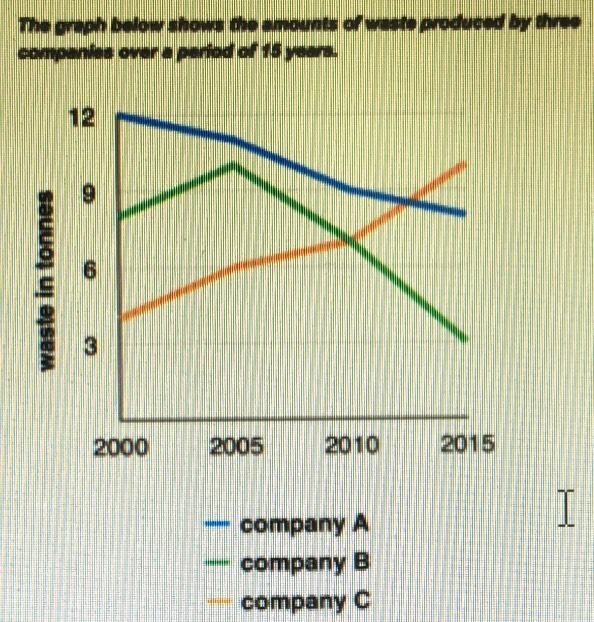
Get the Weekly English Kit 📬
New words, one handy idiom, and a 2-minute quiz — delivered to your inbox to keep your streak alive.
 Related Questions