
Please Review and Score My IELTS Essay
Topic: The graph below shows the proportion of four different materials that were recycled from 1982 to 2010 in a particular country. Summarize the information by selecting and reporting the main features, and make comparisons where relevant.
My essay:
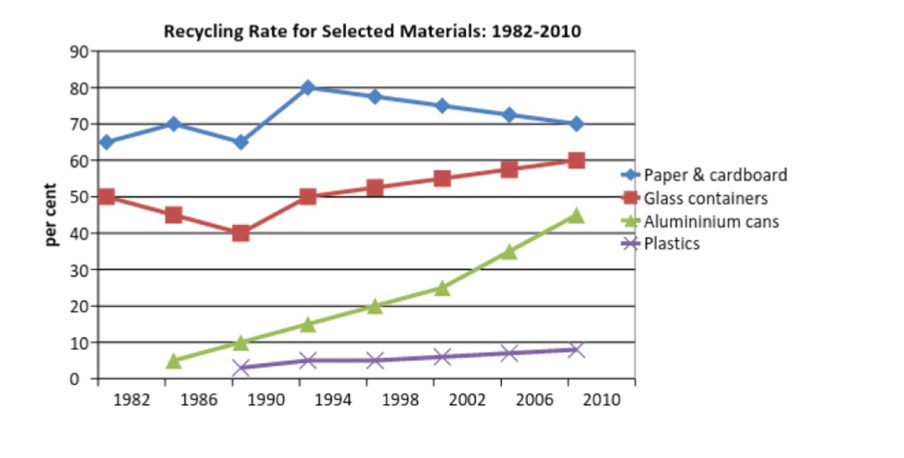
The line graph shows the recycling percentage of paper & cardboard, glass containers, aluminum cans and plastic in one country between 1982 and 2010.
In 1982, about 65% of paper & cardboard was recycled. This figure fluctuated from then to 1990 and reached its highest rate in 1992 at 80%. However, from then on, the graph decreased at a constant rate to a level of 70% in 2010. In 1982, half of the glass containers was recycled; after dumping to its bottom at 40% in 1988, the figure followed an upward trend: it reached back to 50% in 1992 and then gradually increased until reached its top at 60% in 2010.
Aluminum cans were first recycled in 1984 at a rate of 5%. Between 1984 and 2010, the figure climbed rapidly overtime. In 2010, almost half of the cans was recycled. Not until 1988 were plastics recycled; although the figure climbed constantly, the changing rate was very small: started at about 4% in 1988 and in 2010 it was about 8%.
Overall, although paper & cardboard has the highest recycling rate, its graph fluctuated during investigated period and had an upward trend. Meanwhile, other materials tended to increase in percentages overtime.
Top answer
The line graph shows the recycling percentage of paper & cardboard, glass containers, aluminum cans and plastic which was recycled in one country between 1982 and 2010. Your second paragraph needs to give 2 or three main observations. I have given you this advice before.
- The line graph shows the recycling percentage of paper & cardboard, glass containers, aluminum cans and plastic which was recycled in one country between 1982 and 2010.
- Your second paragraph needs to give 2 or three main observations.
- I have given you this advice before.
- You have ignored it.
- Why should I give you any feedback if you just ignore it?
Get the Weekly English Kit 📬
New words, one handy idiom, and a 2-minute quiz — delivered to your inbox to keep your streak alive.
The line graph shows the recycling percentage of paper & cardboard, glass containers, aluminum cans and plastic which was recycled in one country between 1982 and 2010.
Your second paragraph needs to give 2 or three main observations. I have given you this advice before. You have ignored it. Why should I give you any feedback if yo
 Related Questions