
Please read my IELTS essay
The chart illustrates the ratios of divorce to marriage rate in 2 countries in Northern Europe are Finland and Sweden over the past 5 years.
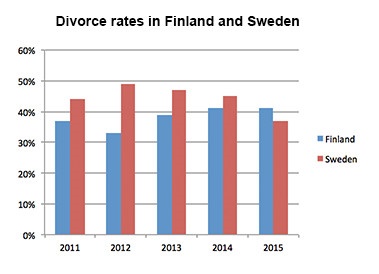
One prominent feature that can be seen from the chart is that the same pattern is the percentage of marriage couple break-up in Sweden was higher than it's in Finland from 2011 to 2014. However, this trend changed promptly in 2015, over 40 percent of Finns divorced, while just approximately 37 percent of Swedes experienced the same thing. This information might reflect the happiness index of these periods in two countries
The proportion of husband and wife decide not to live together any more in Sweden reached the peak in 2012 with about 50 percent, on the contrary, at the same time, the figure of divorce rate in Finland met trough at over 32 percent. The data for the rest of compared years is relatively stable.
Top answer
You did not include the essay instructions. It is difficult to give good feedback if we do not know the instructions. I think these are the instructions, and will use this as a basis for feedback.
- You did not include the essay instructions.
- It is difficult to give good feedback if we do not know the instructions.
- I think these are the instructions, and will use this as a basis for feedback.
- It it is wrong, then the feedback will not be accurate.
- The bar chart shows the divorce rates in two European countries from 2011 to 2015.
Get the Weekly English Kit 📬
New words, one handy idiom, and a 2-minute quiz — delivered to your inbox to keep your streak alive.
You did not include the essay instructions. It is difficult to give good feedback if we do not know the instructions.
I think these are the instructions, and will use this as a basis for feedback. It it is wrong, then the feedback will not be accurate.
The bar chart shows the divorce rates in two European countries from 2011 to 2015.
Summarise the information by selecting a
The chart (What kind of chart is it? ) illustrates (poor word choice. Read my advice.) the ratios of divorce to marriage rate (incorrect, according to the instructions. ) in 2 I(write
 Related Questions