
Please rate my IELTS Writing task 1
The table below gives information on consumer spending on different items in five different countries in 2002.
Summarize the information by selecting and reporting the main features and make comparisons where relevant.
The given table compares 5 different countries in terms of the percentages of consumer expenditure spent on 3 categories of items in the year 2002.
Overall, the proportion of food, drink and tobacco was highest, while the opposite was true for leisure and education. Additionally, the figure for Turkey was almost higher than the other countries shown.
In terms of food/drinks/tobacco, the data of Turkey was highest, with about 32%, followed by Ireland, accounting for nearly 29%.In addition, in Italy, people most spent money in clothing and footwear, while the figure for Sweden was lowest, with 5.4%.
Unlike 2 types of items above, the percentage of spending on leisure and education was lowest on the group. In this category, the largest figure was seen in Turkey, with about 4.35%, slightly higher than that of Italy and Sweden, which were around 3.2% each. Moreover, only 1.98% of expenditure was spent on education and entertainment in Spain.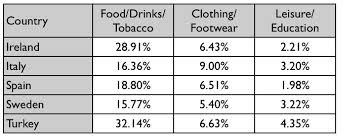
Top answer
The given table compares [ 1 ] five different countries in terms of the percentages of consumer expenditure spent o n three categories of items in the year 2002. [ 2] Overall, the proportion of spending on food, drink s and tobacco was highest, while the opposite was true for leisure and education. Additionally, almost all the figure s for Turkey was almost were higher than those for the other countries shown.
- The given table compares [ 1 ] five different countries in terms of the percentages of consumer expenditure spent o n three categories of items in the year 2002.
- [ 2] Overall, the proportion of spending on food, drink s and tobacco was highest, while the opposite was true for leisure and education.
- Additionally, almost all the figure s for Turkey was almost were higher than those for the other countries shown.
- In terms of food/drinks/tobacco, the data of for Turkey was highest, with at about 32%, followed by Ireland, accounting for nearly 29% .
- 4%.
Get the Weekly English Kit 📬
New words, one handy idiom, and a 2-minute quiz — delivered to your inbox to keep your streak alive.
The given table compares [ 1] five different countries in terms of the percentages of consumer expenditure spent on three categories of items in the year 2002.
[ 2]
Overall, the proportion of
 Related Questions