
Please mark my essay. Thank you for your help!
The charts below show the changes in ownership of electrical appliances and amount of time spent doing housework and households in one country between 1920 and 2019.
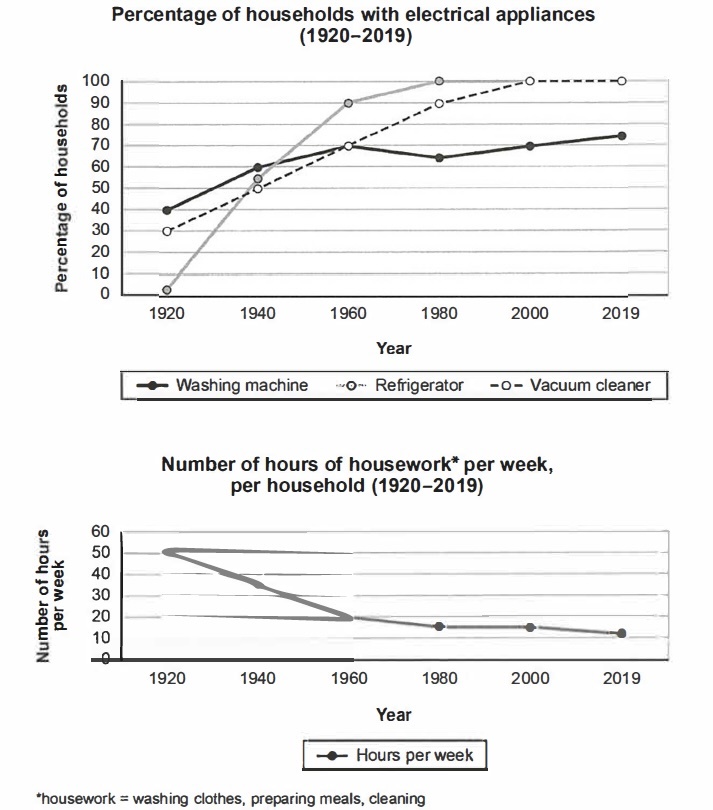
The two line charts indicate the percentage of households owning electrical gadgets and the number of hours people spend doing housework per week between 1920 and 2019.
Overall, the proportion of people using electrical devices increased significantly over the period; as a result, people spend far less time doing housework.
Looking at the first chart, almost no one had the refrigerator in 1920, but through 60 years, there was a dramatic growth in the proportion of households owning this machine, reaching a peak of 100% in 1980. Following the same trend, the figure for residents having the vacuum cleaner climbed significantly, just 30% at the beginning, but in the year 2019, everyone could possess this device. Regarding the washing machine, the percentage of households owning this appliance was the highest in 1920 (at 40%), then fluctuated over 80 years, and at the end of the period, about 60% of households had this machine.
Turning to the second chart, in 1920, people spent 50 hours per week doing housework, but after nearly a century, the number of hours to do household chores plummeted, to just 10 hours per week in 2019 thanks to convenient electrical appliances
Top answer
Please read my advice for Task 1 essays: IELTS TASK 1: Hints, Tips And Advice Vocabulary Words For Task 1: Reference Post
- Please read my advice for Task 1 essays: IELTS TASK 1: Hints, Tips And Advice Vocabulary Words For Task 1: Reference Post
Get the Weekly English Kit 📬
New words, one handy idiom, and a 2-minute quiz — delivered to your inbox to keep your streak alive.
Khanhchi1508The two linecharts
The correct name is "graph" not "chart."
Khanhchi1508indicate
Not a good verb. Read my advice.
Khanhchi1508 electrical gadgets
A gadget is a small rather inexpensive item that is an accessory or a tool. There are no gadgets on th
 Related Questions