
Please, IELTS Writing Task 1
Task 1:
THE CHART BELOW SHOWS THE RESULTS OF A SURVEY ABOUT PEOPLE'S COFFEE AND TEA BUYING AND DRINKING HABITS IN FIVE AUSTRALIAN CITIES.
_________________________________________________________________________________________________________________________
The bar chart illustrates the habits of customers in five cities in Australia about using coffee and tea.
Overall, it is immediately apparent that the percentage of people who went to the cafe for coffee or tea in the last 4 weeks were significantly higher than two others.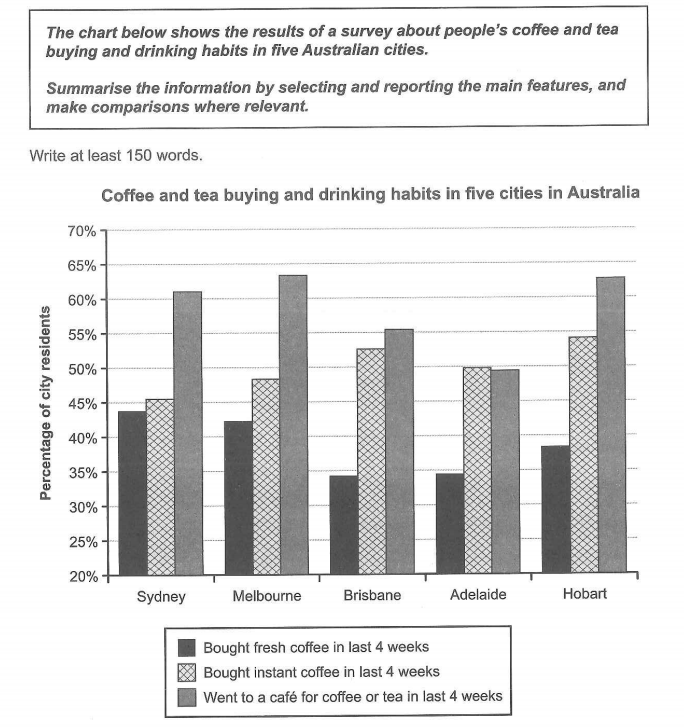
Looking at the graph, the number of people drinking coffee and tea stood at nearly 65% in Melbourne. The figure was mostly similar for people in Sydney and Hobart. Adelaide and Brisbane witnessed a great number of drinking in cafes, at about 50% and 55% respectively. While consuming instant coffee in Hobart was nearly 55%, the figure for this purpose in Melbourne was noticeably lower, at more than 45%
The proportion of people buying fresh coffee accounted for about 45% in Sydney and Melbourne. While the figure for Brisbane and Adelaide was approximately 35%, Hobart saw a gradual increase in consumers using fresh coffee, at more than 35%.
Top answer
Please read my advice for Task 1 essays: IELTS TASK 1: Hints, Tips And Advice Vocabulary Words For Task 1: Reference Post
- Please read my advice for Task 1 essays: IELTS TASK 1: Hints, Tips And Advice Vocabulary Words For Task 1: Reference Post
Get the Weekly English Kit 📬
New words, one handy idiom, and a 2-minute quiz — delivered to your inbox to keep your streak alive.
Please read my advice for Task 1 essays:
The bar chart illustrates (wrong word. Tell the reader exactly what is plotted.) the habits of customers in five cities in Australia about using coffee and tea. (We do not "use" coffee. We drink it.)
Overall, it is immediately
 Related Questions