
PLEASE HLEP ME WITH THIS TASK 1. THANK YOU SO MUCH
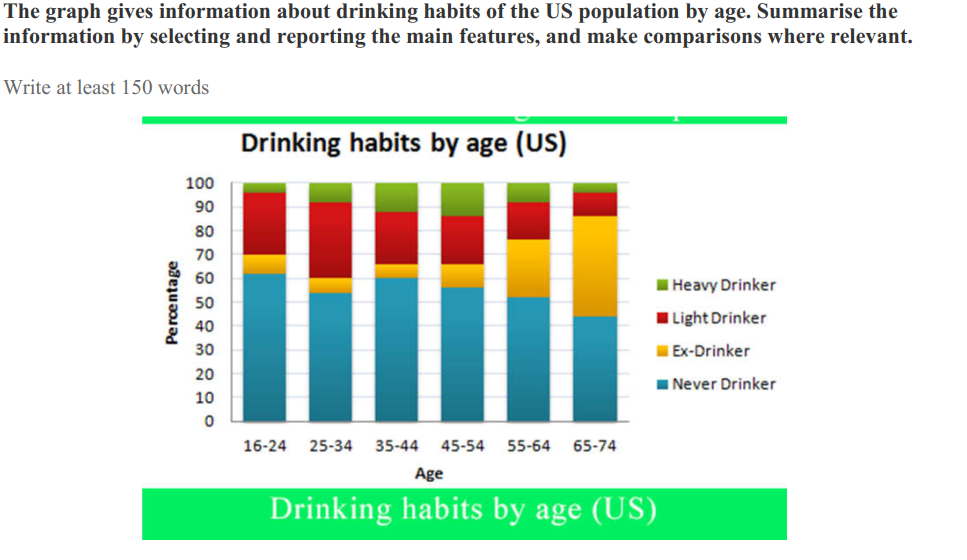
The graph shows the information about the drinking behavior in US dependent on age.It is clear that age has a huge influence on drinking habit which changes significantly.
As can be seen from the graph, the highest proportion of people who never drink was in the 16-24 group. The proportion tended to decreased by age from 62% of 16-24 group to 45% of 65-74 group. By contrast, the proportion of people who used to drink increased considerably by age, only 5% of total in 25-34 group but there was 40% of 65-74 group.
The proportion of light drinker tended to be the young people, accounted for 25% people in total of 24-35 group. From that point onwards, this figure had decreased remarkably to 6% of 65-74 group. The people in middle age (35 to 54) tended to be the heaviest drinker,approximately 13 in total of 35-44 group and declined slightly to 5% in total of 65-74 group.
Thank for your attention.
Top answer
) shows the information about (be more specific) the drinking behavior in the US dependent on by age. It is clear that age has a huge influence on drinking habit which changes significantly. As can be seen from the graph, (In Task 1, the instructions are to describe the figure for a university professor.
- ) shows the information about (be more specific) the drinking behavior in the US dependent on by age.
- It is clear that age has a huge influence on drinking habit which changes significantly.
- As can be seen from the graph, (In Task 1, the instructions are to describe the figure for a university professor.
- Do not write opinions or draw conclusions.
- "It is clear" is your opinion.
Get the Weekly English Kit 📬
New words, one handy idiom, and a 2-minute quiz — delivered to your inbox to keep your streak alive.
The graph (what kind of graph?) shows the information about (be more specific) the drinking behavior in the US dependent on by age.It is clear that age has a huge influence on drinking habit which changes significantly.
 Related Questions