
Please help with my writing task 1
The charts below show the percentage of water used for different purposes in six areas of the world.
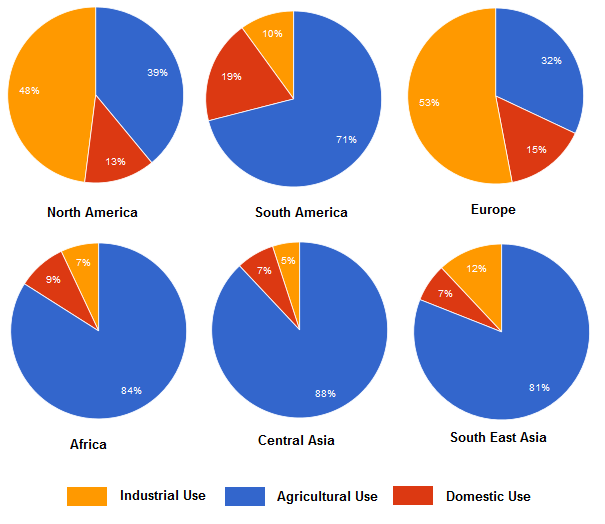
The pie charts compare six places in the earth in term of different ways to use water. Overall, spending water for agriculture accounts for the largest proportion of almost areas. However, North America and Europe prefer to employ water for industrial.
Regarding to North America and Europe, most water consumption was used for industrial which comprise a haft, 48% and 53% respectively. In term of agricultural use, the figure for the North America is slightly more than that of the Europe, which is about 7% higher. The percentage of spending water for domestic is lowest in both nations, just nearly 14% of total.
Most water in the other regions is for agriculture, with the highest figure belonging to Central Asia, at 88%. Spending water for domestic is quite larger than industrial in three nations (except South East Asia), with accounting for around 7% to 19%. In contrast, South East Asia uses more water for industrial, which the figure for domestic was equal 7% with Central Asia.
Top answer
Thao Nguyen, Why do I have to repeat the same advice I gave you earlier? Didn't you pay any attention to it? htm If you do not learn anything from my feedback, what good is it?
- Thao Nguyen, Why do I have to repeat the same advice I gave you earlier?
- Didn't you pay any attention to it?
- htm If you do not learn anything from my feedback, what good is it?
- The pie charts compare six places (wrong word.
- ) in (wrong word.
Get the Weekly English Kit 📬
New words, one handy idiom, and a 2-minute quiz — delivered to your inbox to keep your streak alive.
Thao Nguyen, Why do I have to repeat the same advice I gave you earlier? Didn't you pay any attention to it?
https://www.englishforums.com/English/PleaseWritingTask1/bxgcnn/post.htm
If you do not learn anything from my feedback, what good is it?
 Related Questions