
Please help with my writing task 1
The chart below shows the percentage of households in owned and rented accommodation in England and Wales between 1918 and 2011.
The bar chart compares households in term of buying or renting accommodation in England and Wales from 1918 to 2011. Overall, the percentage households in owed accommodation increased consistently while there was a gradual decline in the rented houses over the period 93 years. But there was a year that have the same figure in both ways.
In the first year, the proportion of houses being rented was highest, at around 86%. By contrast, the rate for owed houses was at the lowest point of nearly 25%. Then, there were a gradual rise in the percentage of households in owned accommodation and remained steadily about 32% between 1939 and 1953. After that, it reached the peak at exactly 50% in 1971. In contrast, the figure for rented house fall steadily and also stayed stable around 70% in the next period. In 1971, it decreased to equal figure with owed houses.
From 1981 to 2011, the percentage of families owing house accommodation went up continuously and peaked at nearly 70% before a decline of about 5 % in the final year. The figure for rented houses hit a lowest point in 2001, falling to 32% , followed by a small rise of 5%.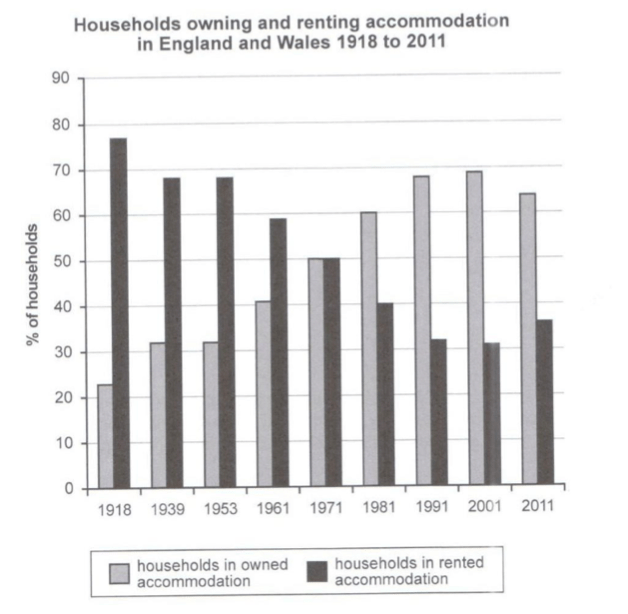
Top answer
htm The bar chart compares households in term of buying or renting accommodation in England and Wales from 1918 to 2011. Overall, the percentage households in owed accommodation increased consistently while there was a gradual decline in the rented houses over the 93-year period 93 years. But there was a year that have the same figure in both ways.
- htm The bar chart compares households in term of buying or renting accommodation in England and Wales from 1918 to 2011.
- Overall, the percentage households in owed accommodation increased consistently while there was a gradual decline in the rented houses over the 93-year period 93 years.
- But there was a year that have the same figure in both ways.
- Paragraph 1: Describe the figure, not the data.
- g.
Get the Weekly English Kit 📬
New words, one handy idiom, and a 2-minute quiz — delivered to your inbox to keep your streak alive.
You can review my model essay in my reply to another user's post here:
https://www.englishforums.com/English/WritingTask1AChart/bnzkgr/post.htm#sc2533507
Read this reference on misused vocabulary words:
 Related Questions